
- Startseite >
- Flüsse >
- Wasserstand >
- Oberer Main - Elbe >
- Langenau >
- Jahresgrafik

Jahresgrafik Langenau / Langenaubach
Wasserstand vom 20.01.2021 bis zum 19.01.2022
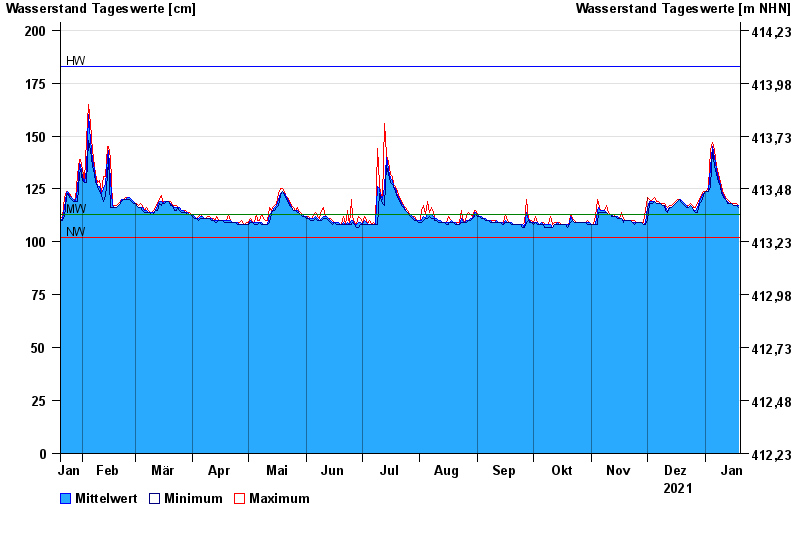
| Datum | Mittelwert [cm] | Maximum [cm] | Minimum [cm] |
|---|---|---|---|
| 19.01.2022 | 117 | 117 | 116 |
| 18.01.2022 | 117 | 118 | 117 |
| 17.01.2022 | 117 | 118 | 117 |
| 16.01.2022 | 117 | 118 | 117 |
| 15.01.2022 | 118 | 118 | 118 |
| 14.01.2022 | 118 | 119 | 118 |
| 13.01.2022 | 119 | 120 | 118 |
© Bayerisches Landesamt für Umwelt 2024