
- Startseite >
- Flüsse >
- Wasserstand >
- Oberer Main - Elbe >
- Hallerndorf >
- Jahresgrafik

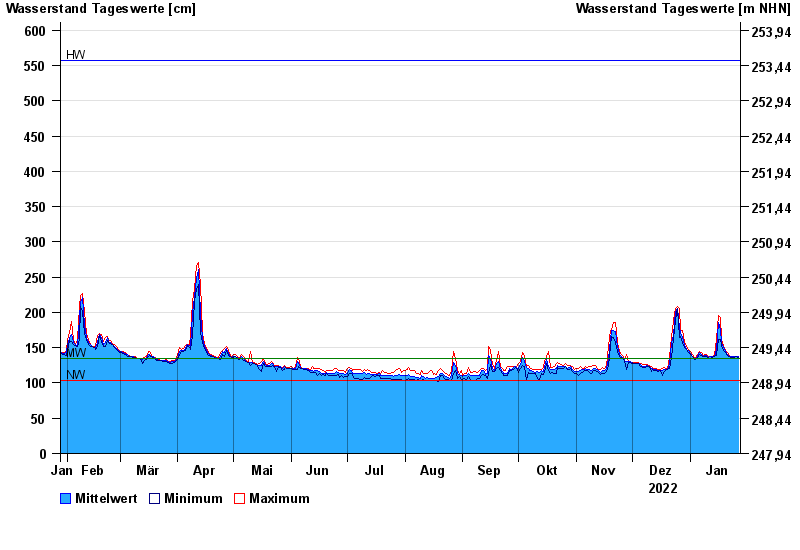
Jahresgrafik Hallerndorf / Aisch
Wasserstand vom 28.01.2022 bis zum 27.01.2023
| Datum | Mittelwert [cm] | Maximum [cm] | Minimum [cm] |
|---|---|---|---|
| 27.01.2023 | 137 | 137 | 136 |
| 26.01.2023 | 137 | 137 | 137 |
| 25.01.2023 | 137 | 137 | 136 |
| 24.01.2023 | 137 | 137 | 136 |
| 23.01.2023 | 137 | 138 | 136 |
| 22.01.2023 | 137 | 139 | 137 |
| 21.01.2023 | 141 | 143 | 139 |
© Bayerisches Landesamt für Umwelt 2024