
- Startseite >
- Flüsse >
- Wasserstand >
- Oberer Main - Elbe >
- Grafenwöhr >
- Jahresgrafik

Jahresgrafik Grafenwöhr / Creußen
Wasserstand vom 01.01.2024 bis zum 18.04.2024
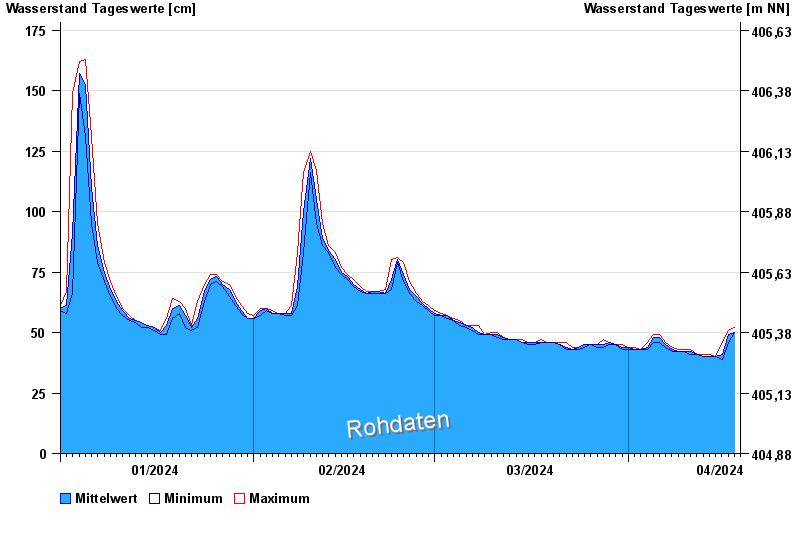
| Datum | Mittelwert [cm] | Maximum [cm] | Minimum [cm] |
|---|---|---|---|
| 18.04.2024 | 50 | 50 | 50 |
| 17.04.2024 | 49 | 51 | 46 |
| 16.04.2024 | 41 | 46 | 39 |
| 15.04.2024 | 40 | 40 | 40 |
| 14.04.2024 | 40 | 41 | 40 |
| 13.04.2024 | 40 | 41 | 40 |
| 12.04.2024 | 41 | 41 | 41 |
© Bayerisches Landesamt für Umwelt 2024