
- Startseite >
- Flüsse >
- Wasserstand >
- Bayern >
- Wiblingen >
- Jahresgrafik

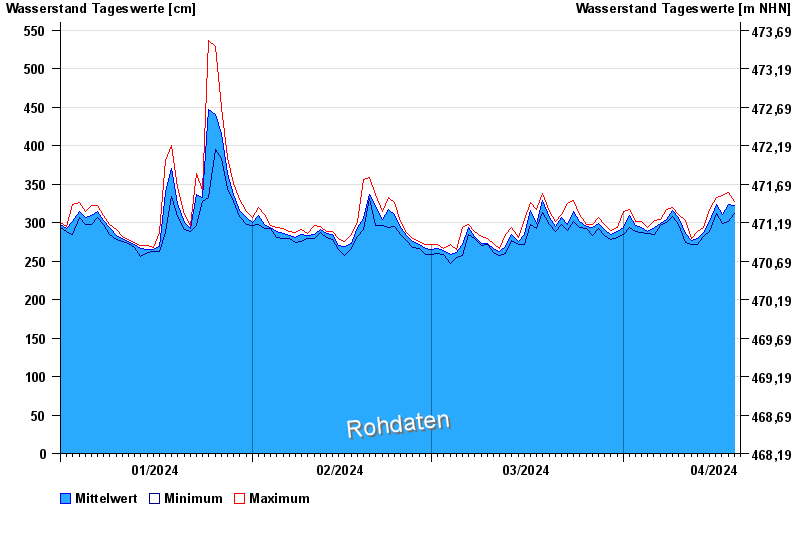
Jahresgrafik Wiblingen / Iller
Wasserstand vom 01.01.2024 bis zum 19.04.2024
- 23.05.1999 Wasserstand: 752 cm
- 24.08.2005 Wasserstand: 739 cm
- 02.06.2013 Wasserstand: 705 cm
- 13.08.2002 Wasserstand: 694 cm
- 13.05.1999 Wasserstand: 664 cm
| Datum | Mittelwert [cm] | Maximum [cm] | Minimum [cm] |
|---|---|---|---|
| 19.04.2024 | 323 | 327 | 312 |
| 18.04.2024 | 323 | 339 | 302 |
| 17.04.2024 | 311 | 335 | 299 |
| 16.04.2024 | 323 | 332 | 312 |
| 15.04.2024 | 302 | 317 | 288 |
| 14.04.2024 | 287 | 293 | 282 |
| 13.04.2024 | 280 | 289 | 272 |
© Bayerisches Landesamt für Umwelt 2024