
- Startseite >
- Flüsse >
- Wasserstand >
- Bayern >
- Wertheim >
- Jahresgrafik

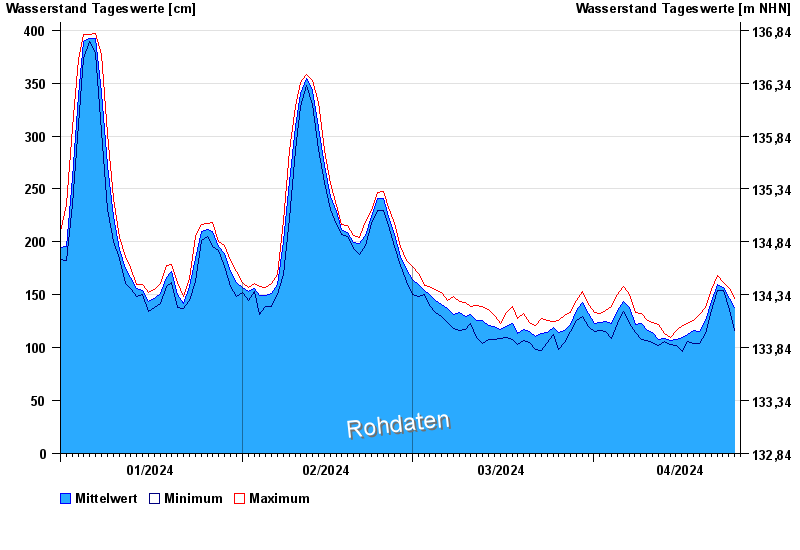
Jahresgrafik Wertheim / Main
Wasserstand vom 01.01.2024 bis zum 25.04.2024
- 26.02.1970 Wasserstand: 610 cm
- 04.01.2003 Wasserstand: 608 cm
- 17.01.2011 Wasserstand: 595 cm
- 02.11.1998 Wasserstand: 543 cm
- 07.02.1980 Wasserstand: 480 cm
| Datum | Mittelwert [cm] | Maximum [cm] | Minimum [cm] |
|---|---|---|---|
| 25.04.2024 | 145 | 146 | 141 |
| 24.04.2024 | 146 | 156 | 136 |
| 23.04.2024 | 157 | 162 | 154 |
| 22.04.2024 | 160 | 168 | 154 |
| 21.04.2024 | 144 | 155 | 135 |
| 20.04.2024 | 126 | 138 | 113 |
| 19.04.2024 | 115 | 131 | 104 |
© Bayerisches Landesamt für Umwelt 2024