
- Startseite >
- Flüsse >
- Wasserstand >
- Bayern >
- Wertheim >
- Jahresgrafik

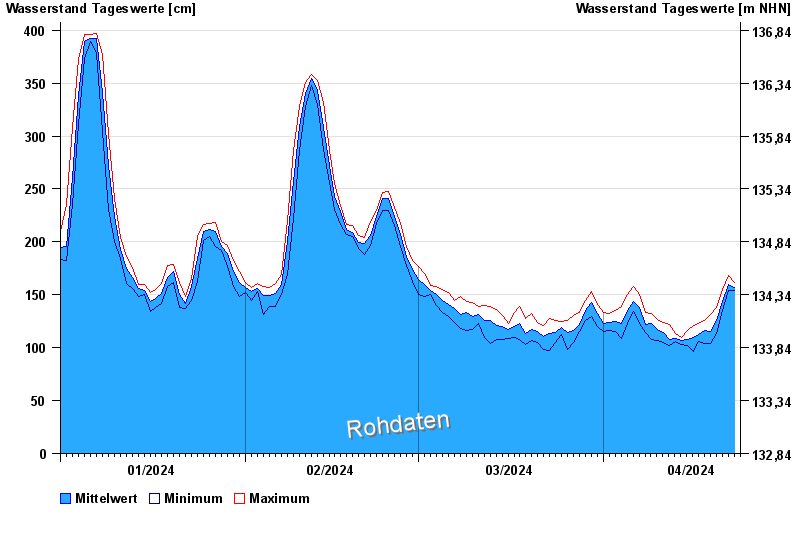
Jahresgrafik Wertheim / Main
Wasserstand vom 01.01.2024 bis zum 23.04.2024
 Für diesen Pegel sind keine Meldestufen hinterlegt.
| Datum | Mittelwert [cm] | Maximum [cm] | Minimum [cm] |
|---|---|---|---|
| 23.04.2024 | 155 | 157 | 154 |
| 22.04.2024 | 160 | 168 | 154 |
| 21.04.2024 | 144 | 155 | 135 |
| 20.04.2024 | 126 | 138 | 113 |
| 19.04.2024 | 115 | 131 | 104 |
| 18.04.2024 | 116 | 126 | 104 |
| 17.04.2024 | 112 | 123 | 106 |
© Bayerisches Landesamt für Umwelt 2024