
- Startseite >
- Flüsse >
- Wasserstand >
- Bayern >
- Weilheim >
- Jahresgrafik

Jahresgrafik Weilheim / Ammer
Wasserstand vom 01.01.2024 bis zum 23.04.2024
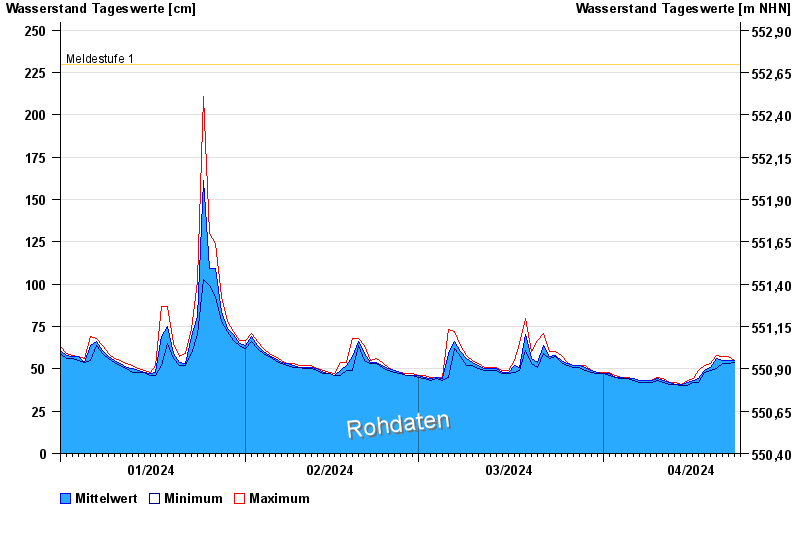
- Meldestufe 1 230 cm
- Meldestufe 3 370 cm
- Meldestufe 4 420 cm
- Hochwassergefahrenfläche HQ100 490 cm
| Datum | Mittelwert [cm] | Maximum [cm] | Minimum [cm] |
|---|---|---|---|
| 23.04.2024 | 55 | 55 | 54 |
| 22.04.2024 | 55 | 57 | 53 |
| 21.04.2024 | 55 | 57 | 53 |
| 20.04.2024 | 56 | 58 | 50 |
| 19.04.2024 | 51 | 53 | 49 |
| 18.04.2024 | 49 | 52 | 48 |
| 17.04.2024 | 44 | 49 | 42 |
© Bayerisches Landesamt für Umwelt 2024