
- Startseite >
- Flüsse >
- Wasserstand >
- Bayern >
- Viechtach Reibenmühle >
- Jahresgrafik

Jahresgrafik Viechtach Reibenmühle / Aitnach
Wasserstand vom 07.12.2021 bis zum 06.12.2022
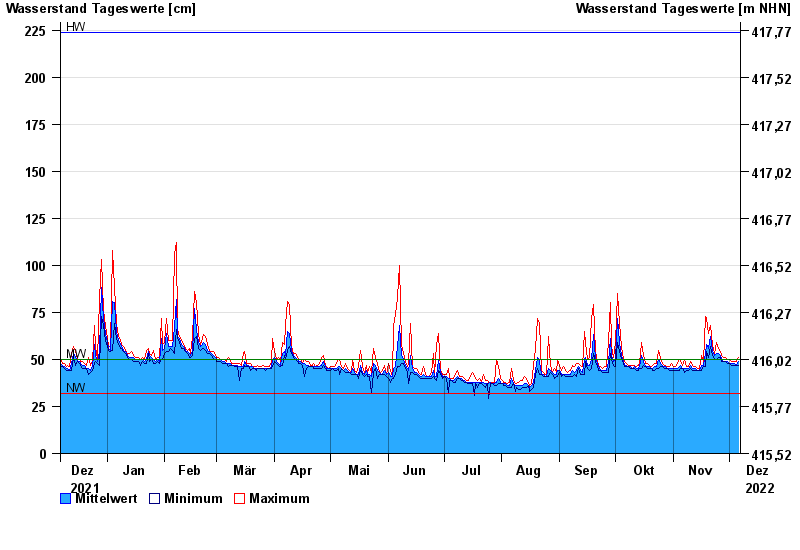
| Datum | Mittelwert [cm] | Maximum [cm] | Minimum [cm] |
|---|---|---|---|
| 06.12.2022 | 49 | 51 | 47 |
| 05.12.2022 | 47 | 49 | 47 |
| 04.12.2022 | 48 | 49 | 47 |
| 03.12.2022 | 48 | 49 | 47 |
| 02.12.2022 | 48 | 49 | 47 |
| 01.12.2022 | 48 | 50 | 48 |
| 30.11.2022 | 49 | 50 | 48 |
© Bayerisches Landesamt für Umwelt 2024