
- Startseite >
- Flüsse >
- Wasserstand >
- Bayern >
- Viechtach Reibenmühle >
- Jahresgrafik

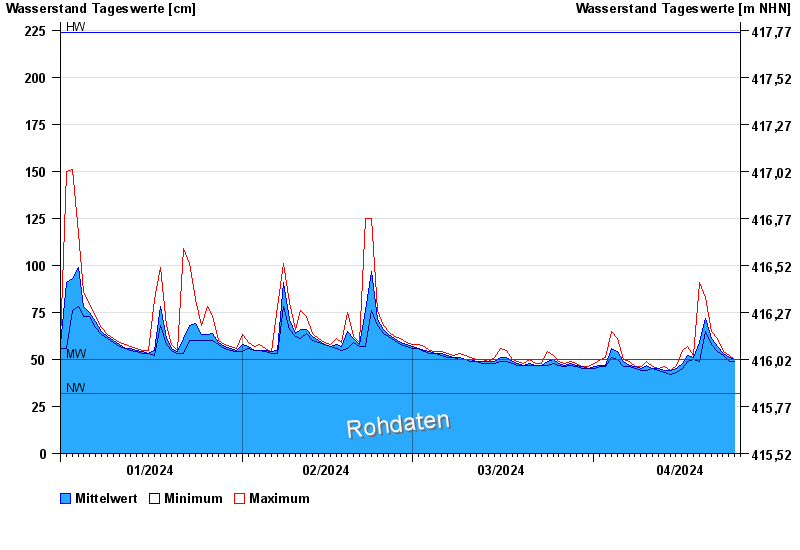
Jahresgrafik Viechtach Reibenmühle / Aitnach
Wasserstand vom 01.01.2024 bis zum 25.04.2024
| Datum | Mittelwert [cm] | Maximum [cm] | Minimum [cm] |
|---|---|---|---|
| 25.04.2024 | 50 | 50 | 50 |
| 24.04.2024 | 51 | 52 | 49 |
| 23.04.2024 | 53 | 54 | 52 |
| 22.04.2024 | 57 | 61 | 54 |
| 21.04.2024 | 61 | 65 | 58 |
| 20.04.2024 | 72 | 83 | 65 |
| 19.04.2024 | 59 | 91 | 49 |
© Bayerisches Landesamt für Umwelt 2024