
- Startseite >
- Flüsse >
- Wasserstand >
- Bayern >
- Unterweißenbrunn >
- Jahresgrafik

Jahresgrafik Unterweißenbrunn / Brend
Wasserstand vom 18.08.2022 bis zum 17.08.2023
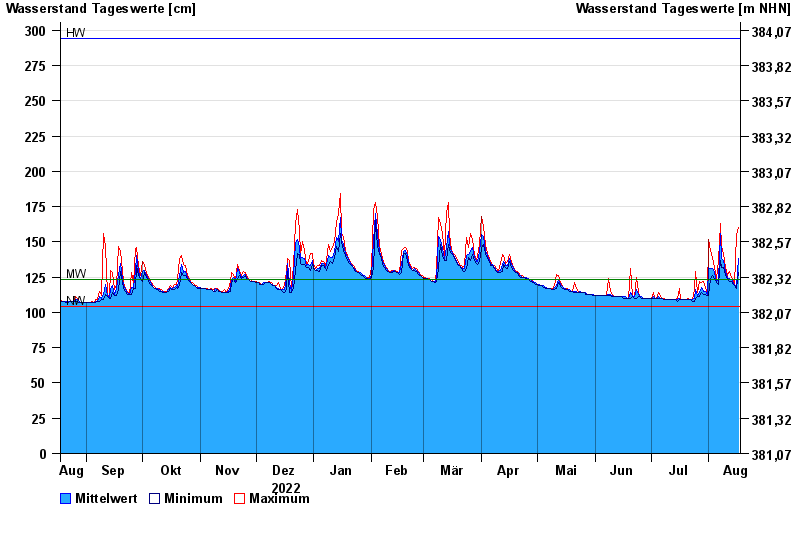
| Datum | Mittelwert [cm] | Maximum [cm] | Minimum [cm] |
|---|---|---|---|
| 17.08.2023 | 138 | 160 | 128 |
| 16.08.2023 | 119 | 155 | 117 |
| 15.08.2023 | 119 | 120 | 119 |
| 14.08.2023 | 121 | 122 | 120 |
| 13.08.2023 | 123 | 125 | 122 |
| 12.08.2023 | 124 | 129 | 122 |
| 11.08.2023 | 125 | 126 | 123 |
© Bayerisches Landesamt für Umwelt 2024