
- Startseite >
- Flüsse >
- Wasserstand >
- Bayern >
- Schönberg >
- Jahresgrafik

Jahresgrafik Schönberg / Große Ohe
Wasserstand vom 01.01.2024 bis zum 16.04.2024
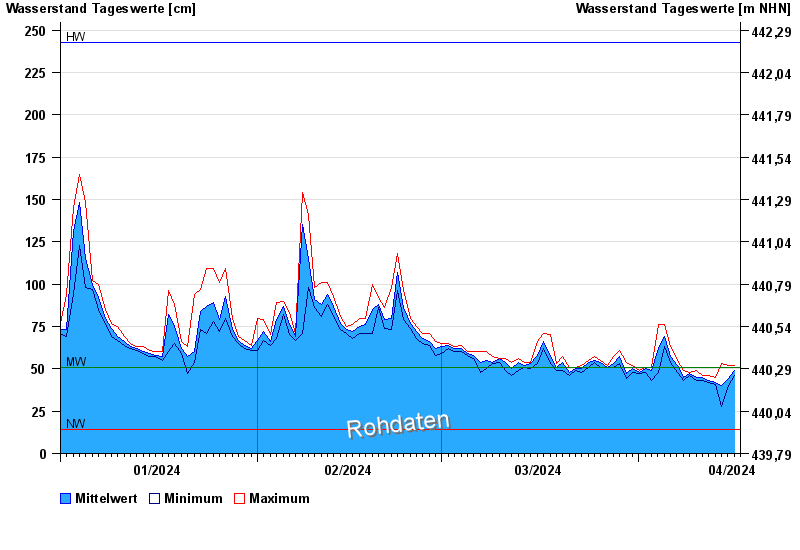
| Datum | Mittelwert [cm] | Maximum [cm] | Minimum [cm] |
|---|---|---|---|
| 16.04.2024 | 49 | 51 | 49 |
| 15.04.2024 | 44 | 52 | 40 |
| 14.04.2024 | 40 | 53 | 28 |
| 13.04.2024 | 42 | 45 | 41 |
| 12.04.2024 | 43 | 46 | 42 |
| 11.04.2024 | 45 | 46 | 43 |
| 10.04.2024 | 45 | 49 | 43 |
© Bayerisches Landesamt für Umwelt 2024