
- Startseite >
- Flüsse >
- Wasserstand >
- Bayern >
- Puppling >
- Jahresgrafik

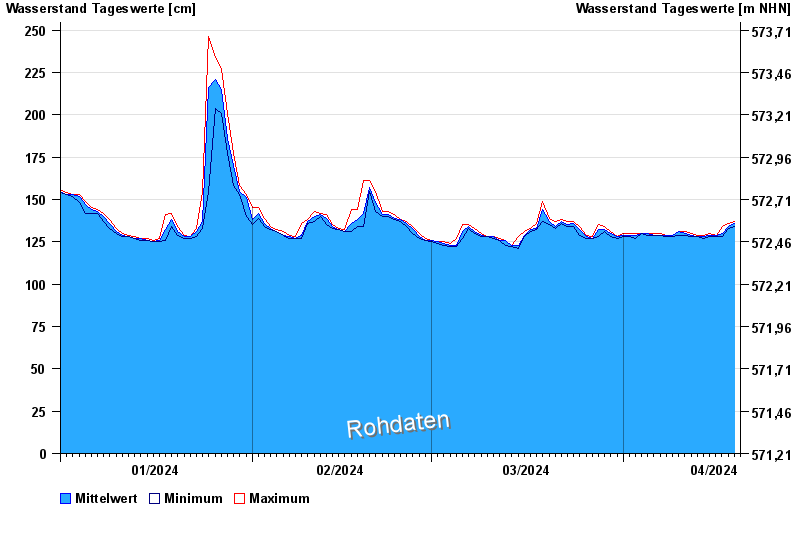
Jahresgrafik Puppling / Isar
Wasserstand vom 01.01.2024 bis zum 19.04.2024
- 23.08.2005 Wasserstand: 459 cm
- 18.06.1979 Wasserstand: 441 cm
- 22.05.1999 Wasserstand: 430 cm
- 20.07.1981 Wasserstand: 426 cm
- 01.08.1977 Wasserstand: 418 cm
| Datum | Mittelwert [cm] | Maximum [cm] | Minimum [cm] |
|---|---|---|---|
| 19.04.2024 | 137 | 137 | 137 |
| 18.04.2024 | 134 | 136 | 133 |
| 17.04.2024 | 130 | 134 | 128 |
| 16.04.2024 | 129 | 129 | 128 |
| 15.04.2024 | 129 | 130 | 128 |
| 14.04.2024 | 128 | 129 | 127 |
| 13.04.2024 | 128 | 129 | 128 |
© Bayerisches Landesamt für Umwelt 2024