
- Startseite >
- Flüsse >
- Wasserstand >
- Bayern >
- Poppenlauer >
- Jahresgrafik

Jahresgrafik Poppenlauer / Lauer
Wasserstand vom 01.01.2024 bis zum 25.04.2024
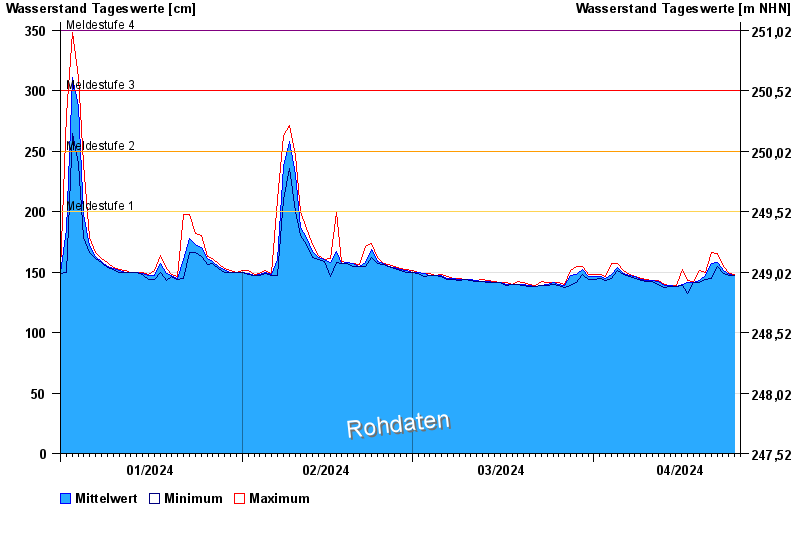
- Meldestufe 1 200 cm
- Meldestufe 2 250 cm
- Meldestufe 3 300 cm
- Meldestufe 4 350 cm
| Datum | Mittelwert [cm] | Maximum [cm] | Minimum [cm] |
|---|---|---|---|
| 25.04.2024 | 147 | 148 | 147 |
| 24.04.2024 | 148 | 149 | 147 |
| 23.04.2024 | 151 | 155 | 149 |
| 22.04.2024 | 158 | 165 | 155 |
| 21.04.2024 | 157 | 166 | 145 |
| 20.04.2024 | 147 | 150 | 144 |
| 19.04.2024 | 143 | 151 | 141 |
© Bayerisches Landesamt für Umwelt 2024