
- Startseite >
- Flüsse >
- Wasserstand >
- Bayern >
- Pfelling >
- Jahresgrafik

Jahresgrafik Pfelling / Donau
Wasserstand vom 09.02.2023 bis zum 08.02.2024
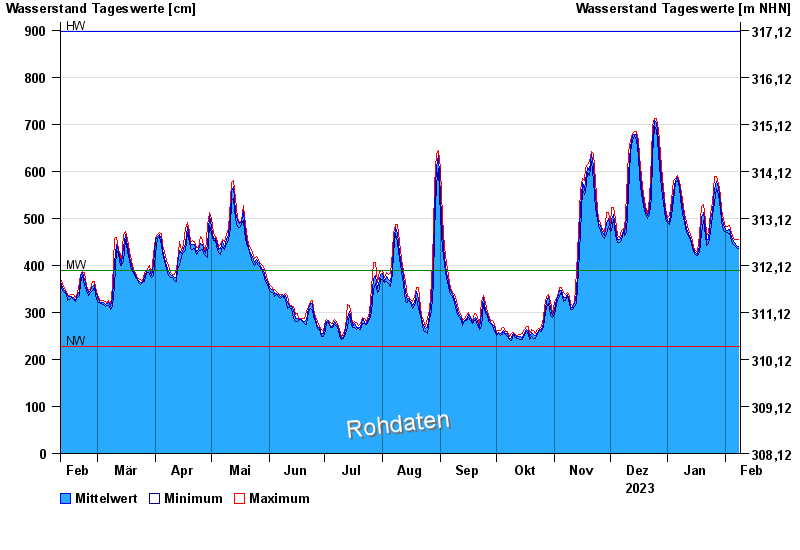
| Datum | Mittelwert [cm] | Maximum [cm] | Minimum [cm] |
|---|---|---|---|
| 08.02.2024 | 441 | 455 | 435 |
| 07.02.2024 | 442 | 456 | 438 |
| 06.02.2024 | 448 | 454 | 443 |
| 05.02.2024 | 450 | 458 | 445 |
| 04.02.2024 | 459 | 469 | 451 |
| 03.02.2024 | 476 | 485 | 467 |
| 02.02.2024 | 475 | 482 | 469 |
© Bayerisches Landesamt für Umwelt 2024