
- Startseite >
- Flüsse >
- Wasserstand >
- Bayern >
- Mettendorf >
- Jahresgrafik

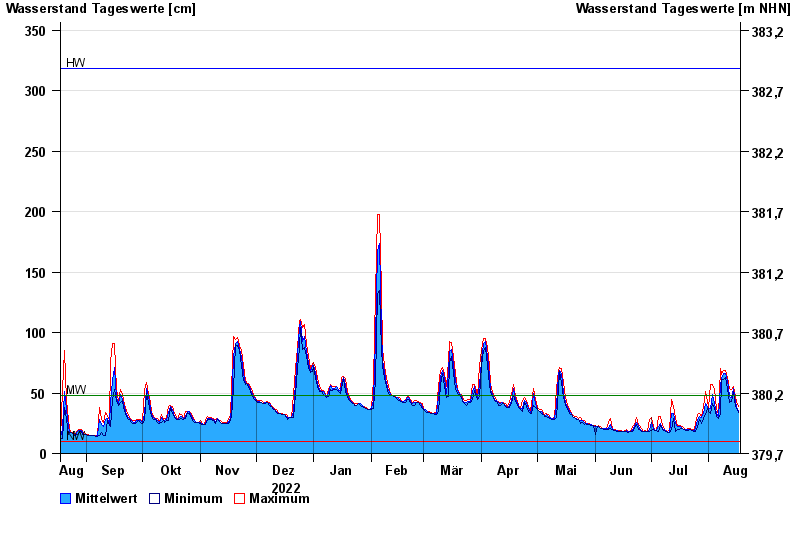
Jahresgrafik Mettendorf / Schwarzach
Wasserstand vom 18.08.2022 bis zum 17.08.2023
| Datum | Mittelwert [cm] | Maximum [cm] | Minimum [cm] |
|---|---|---|---|
| 17.08.2023 | 35 | 39 | 34 |
| 16.08.2023 | 39 | 43 | 37 |
| 15.08.2023 | 47 | 51 | 43 |
| 14.08.2023 | 54 | 55 | 51 |
| 13.08.2023 | 46 | 53 | 43 |
| 12.08.2023 | 47 | 54 | 42 |
| 11.08.2023 | 60 | 63 | 54 |
© Bayerisches Landesamt für Umwelt 2024