
- Startseite >
- Flüsse >
- Wasserstand >
- Bayern >
- Kinding KA >
- Jahresgrafik

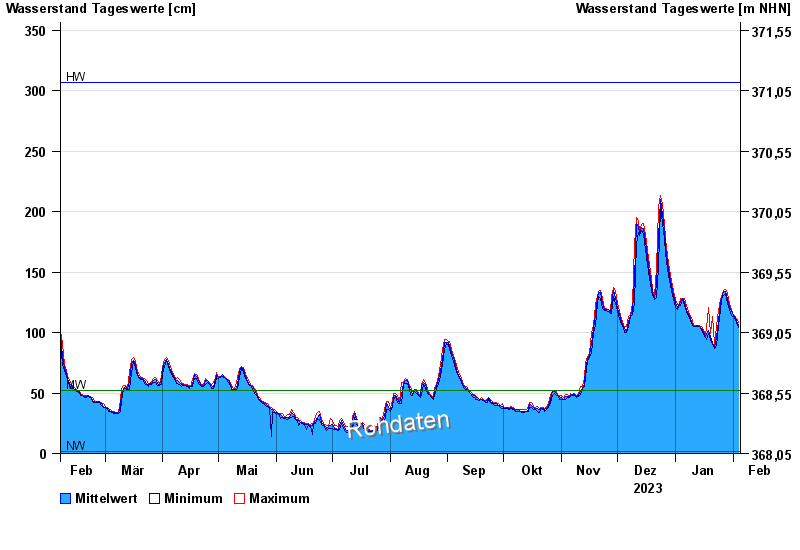
Jahresgrafik Kinding KA / Altmühl
Wasserstand vom 05.02.2023 bis zum 04.02.2024
| Datum | Mittelwert [cm] | Maximum [cm] | Minimum [cm] |
|---|---|---|---|
| 04.02.2024 | 106 | 108 | 104 |
| 03.02.2024 | 110 | 112 | 108 |
| 02.02.2024 | 113 | 114 | 112 |
| 01.02.2024 | 114 | 114 | 113 |
| 31.01.2024 | 117 | 119 | 114 |
| 30.01.2024 | 121 | 124 | 119 |
| 29.01.2024 | 128 | 132 | 124 |
© Bayerisches Landesamt für Umwelt 2024