
- Startseite >
- Flüsse >
- Wasserstand >
- Bayern >
- Kinding KA >
- Jahresgrafik

Jahresgrafik Kinding KA / Altmühl
Wasserstand vom 01.01.2024 bis zum 25.04.2024
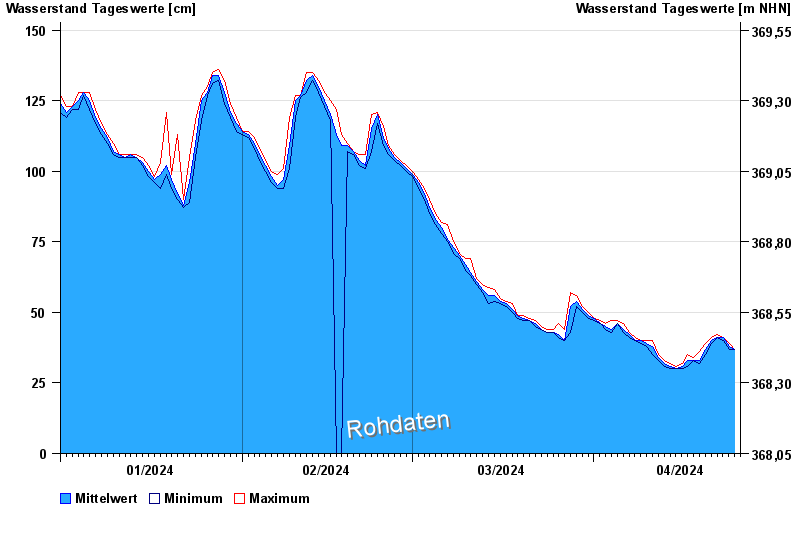
| Datum | Mittelwert [cm] | Maximum [cm] | Minimum [cm] |
|---|---|---|---|
| 25.04.2024 | 37 | 37 | 37 |
| 24.04.2024 | 38 | 39 | 37 |
| 23.04.2024 | 41 | 41 | 40 |
| 22.04.2024 | 41 | 42 | 41 |
| 21.04.2024 | 40 | 41 | 39 |
| 20.04.2024 | 37 | 39 | 35 |
| 19.04.2024 | 33 | 36 | 32 |
© Bayerisches Landesamt für Umwelt 2024