
- Startseite >
- Flüsse >
- Wasserstand >
- Bayern >
- Hechendorf >
- Jahresgrafik

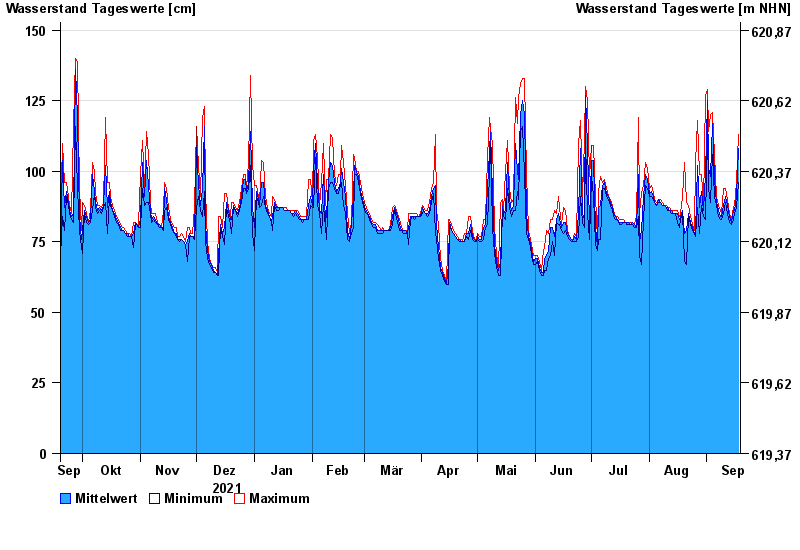
Jahresgrafik Hechendorf / Ramsach
Wasserstand vom 19.09.2021 bis zum 18.09.2022
Hinweis
Messwerte beeinflusst durch Kraftwerkssteuerungen.
| Datum | Mittelwert [cm] | Maximum [cm] | Minimum [cm] |
|---|---|---|---|
| 18.09.2022 | 108 | 113 | 96 |
| 17.09.2022 | 91 | 96 | 87 |
| 16.09.2022 | 86 | 88 | 85 |
| 15.09.2022 | 86 | 87 | 83 |
| 14.09.2022 | 82 | 83 | 81 |
| 13.09.2022 | 84 | 85 | 82 |
| 12.09.2022 | 88 | 90 | 85 |
© Bayerisches Landesamt für Umwelt 2024