
- Startseite >
- Flüsse >
- Wasserstand >
- Bayern >
- Gunzesried >
- Jahresgrafik

Jahresgrafik Gunzesried / Gunzesrieder Ach
Wasserstand vom 04.12.2022 bis zum 03.12.2023
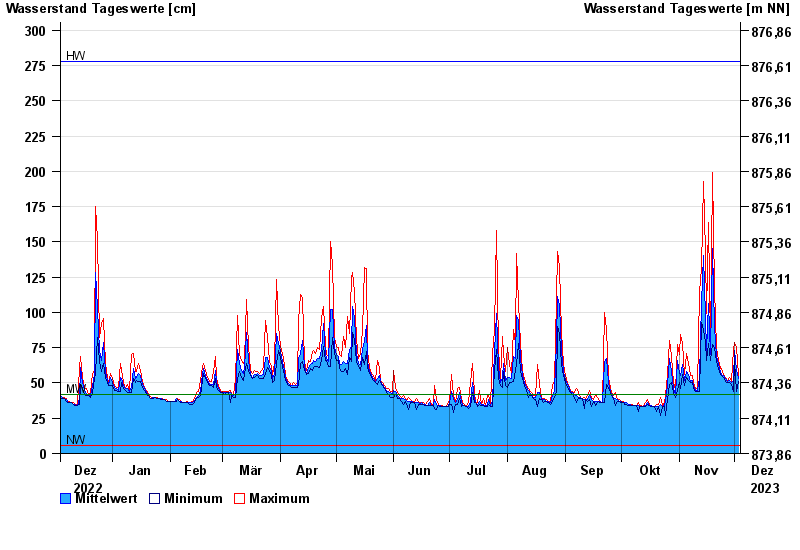
| Datum | Mittelwert [cm] | Maximum [cm] | Minimum [cm] |
|---|---|---|---|
| 03.12.2023 | 53 | 55 | 51 |
| 02.12.2023 | 59 | 75 | 44 |
| 01.12.2023 | 73 | 79 | 65 |
| 30.11.2023 | 52 | 74 | 44 |
| 29.11.2023 | 50 | 51 | 49 |
| 28.11.2023 | 52 | 54 | 50 |
| 27.11.2023 | 51 | 51 | 50 |
© Bayerisches Landesamt für Umwelt 2024