
- Startseite >
- Flüsse >
- Wasserstand >
- Bayern >
- Eschenlohe Brücke >
- Jahresgrafik

Jahresgrafik Eschenlohe Brücke / Loisach
Wasserstand vom 01.01.2024 bis zum 18.04.2024
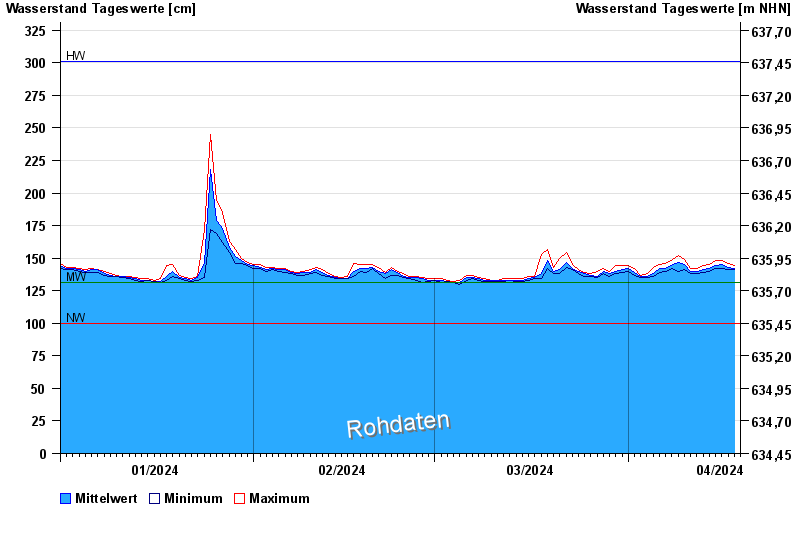
Hinweis
Messwerte beeinflusst durch Kraftwerkssteuerungen.
| Datum | Mittelwert [cm] | Maximum [cm] | Minimum [cm] |
|---|---|---|---|
| 18.04.2024 | 142 | 144 | 141 |
| 17.04.2024 | 143 | 146 | 141 |
| 16.04.2024 | 145 | 148 | 142 |
| 15.04.2024 | 144 | 148 | 142 |
| 14.04.2024 | 142 | 145 | 140 |
| 13.04.2024 | 141 | 144 | 139 |
| 12.04.2024 | 140 | 142 | 138 |
© Bayerisches Landesamt für Umwelt 2024