
- Startseite >
- Flüsse >
- Wasserstand >
- Bayern >
- Eberhardsreuth >
- Jahresgrafik

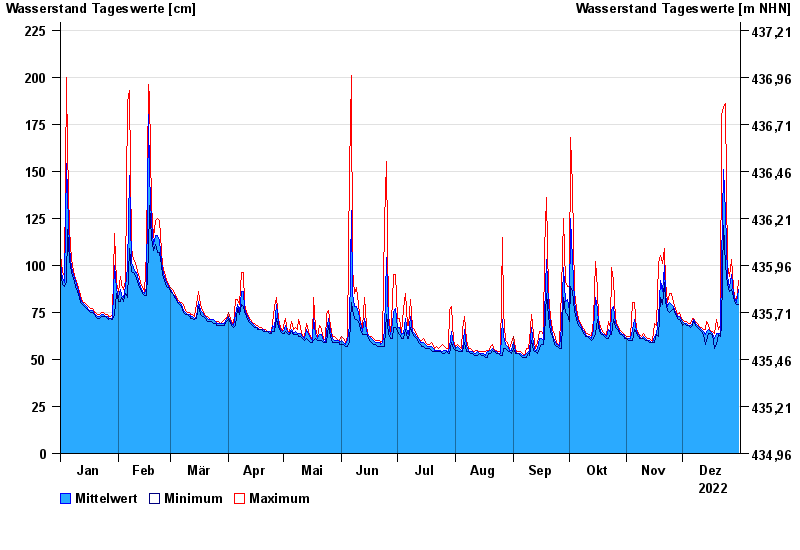
Jahresgrafik Eberhardsreuth / Mitternacher Ohe
Wasserstand vom 01.01.2022 bis zum 31.12.2022
 Für diesen Pegel sind keine Hochwassermarken hinterlegt.
| Datum | Mittelwert [cm] | Maximum [cm] | Minimum [cm] |
|---|---|---|---|
| 31.12.2022 | 87 | 92 | 79 |
| 30.12.2022 | 80 | 81 | 79 |
| 29.12.2022 | 83 | 83 | 81 |
| 28.12.2022 | 85 | 88 | 83 |
| 27.12.2022 | 95 | 103 | 87 |
| 26.12.2022 | 88 | 94 | 86 |
| 25.12.2022 | 94 | 100 | 90 |
© Bayerisches Landesamt für Umwelt 2024