
- Startseite >
- Flüsse >
- Wasserstand >
- Bayern >
- Beilngries oberh. der Sulz >
- Jahresgrafik

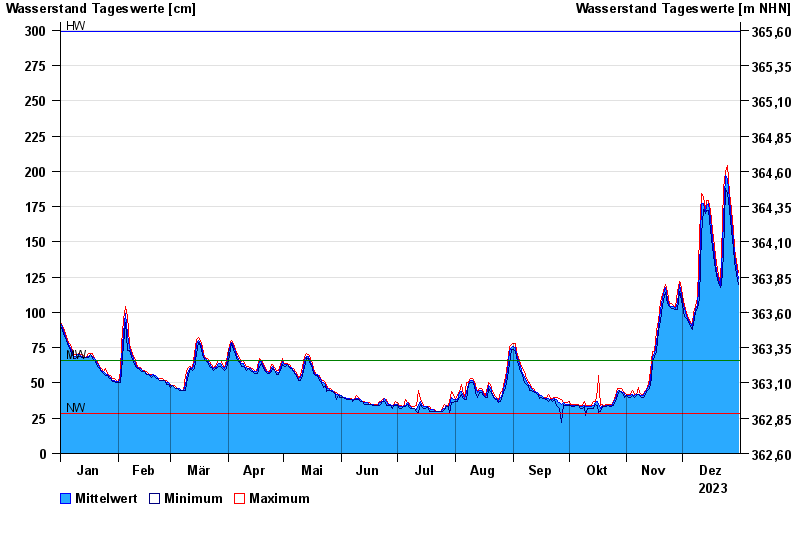
Jahresgrafik Beilngries oberh. der Sulz / Altmühl
Wasserstand vom 01.01.2023 bis zum 31.12.2023
| Datum | Mittelwert [cm] | Maximum [cm] | Minimum [cm] |
|---|---|---|---|
| 31.12.2023 | 124 | 128 | 120 |
| 30.12.2023 | 132 | 136 | 127 |
| 29.12.2023 | 140 | 145 | 136 |
| 28.12.2023 | 152 | 158 | 145 |
| 27.12.2023 | 165 | 173 | 158 |
| 26.12.2023 | 180 | 185 | 173 |
| 25.12.2023 | 194 | 204 | 184 |
© Bayerisches Landesamt für Umwelt 2025