
- Startseite >
- Flüsse >
- Schwebstoff >
- Regnitz >
- Staudach >
- Monatsgrafik

Monatsgrafik Staudach / Tiroler Achen
Schwebstoff vom 12.07.2021 bis zum 11.08.2021
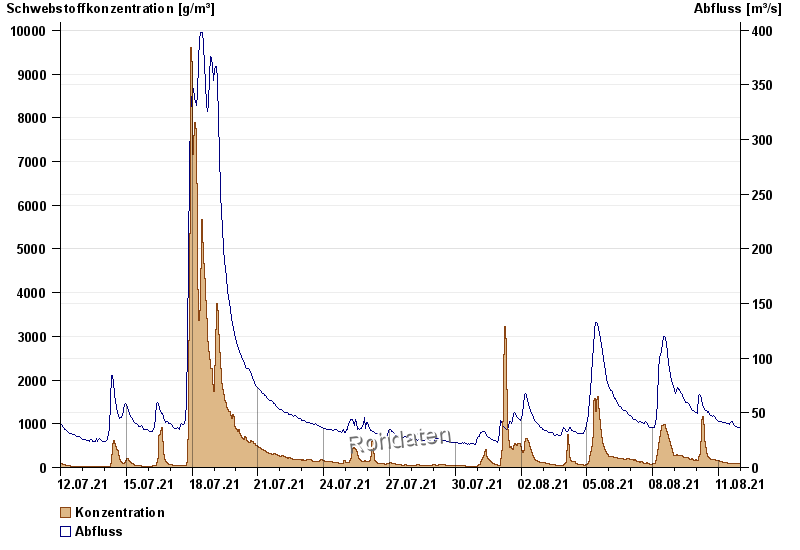
| Datum | Konzentration [g/m³] | Abfluss [m³/s] |
|---|---|---|
| 11.08.2021 23:45 | 82,2 | 35,5 |
| 11.08.2021 23:30 | 81,5 | 35,5 |
| 11.08.2021 23:15 | 79,7 | 35,5 |
| 11.08.2021 23:00 | 80,3 | 35,5 |
| 11.08.2021 22:45 | 80,4 | 36,3 |
| 11.08.2021 22:30 | 80,9 | 36,3 |
| 11.08.2021 22:15 | 80,7 | 36,3 |
© Bayerisches Landesamt für Umwelt 2024