
- Startseite >
- Flüsse >
- Schwebstoff >
- Regnitz >
- Staudach >
- Jahresgrafik

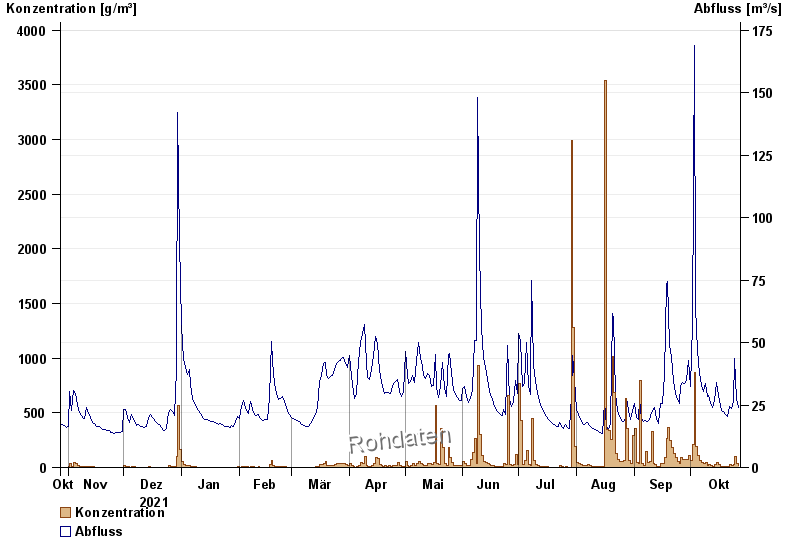
Jahresgrafik Staudach / Tiroler Achen
Schwebstoff vom 28.10.2021 bis zum 27.10.2022
| Datum | Konzentration [g/m³] | Abfluss [m³/s] |
|---|---|---|
| 27.10.2022 | 20,4 | 24 |
| 26.10.2022 | 32,6 | 27,2 |
| 25.10.2022 | 104,0 | 43,6 |
| 24.10.2022 | 31,9 | 26,6 |
| 23.10.2022 | 14,7 | 23,5 |
| 22.10.2022 | 23,4 | 24,6 |
| 21.10.2022 | 7,5 | 20,4 |
© Bayerisches Landesamt für Umwelt 2024