
- Startseite >
- Flüsse >
- Schwebstoff >
- Regnitz >
- Staudach >
- Jahresgrafik

Jahresgrafik Staudach / Tiroler Achen
Schwebstoff vom 12.06.2021 bis zum 11.06.2022
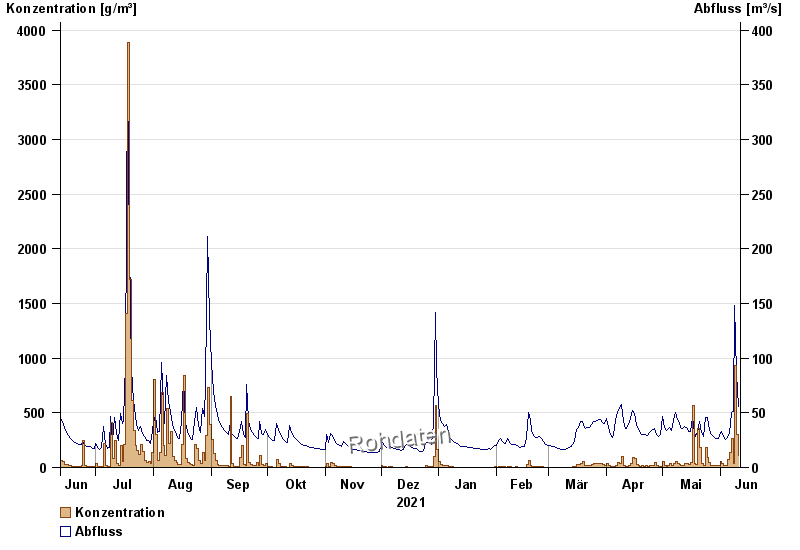
| Datum | Konzentration [g/m³] | Abfluss [m³/s] |
|---|---|---|
| 11.06.2022 | 106,2 | 56 |
| 10.06.2022 | 304,3 | 86,1 |
| 09.06.2022 | 930,7 | 148 |
| 08.06.2022 | 39,8 | 50,9 |
| 07.06.2022 | 266,2 | 50,7 |
| 06.06.2022 | 134,7 | 31,4 |
| 05.06.2022 | 74,1 | 27,5 |
© Bayerisches Landesamt für Umwelt 2024