
- Startseite >
- Flüsse >
- Schwebstoff >
- Regnitz >
- Staudach >
- Jahresgrafik

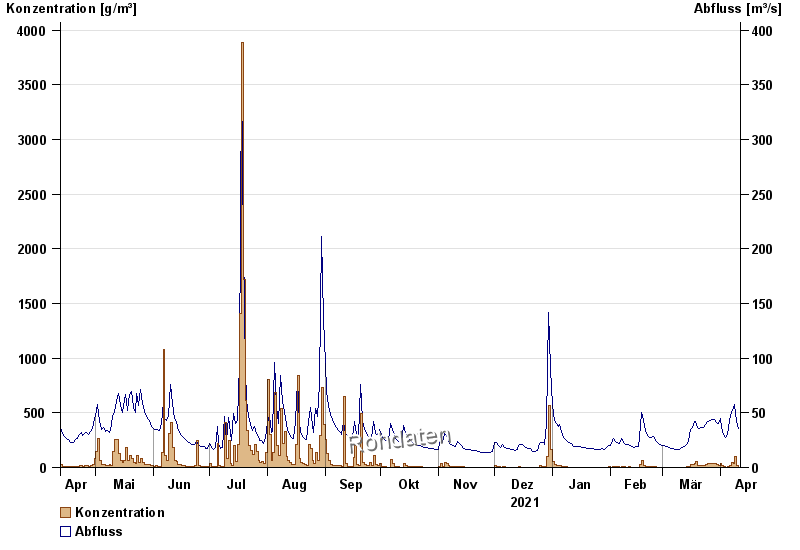
Jahresgrafik Staudach / Tiroler Achen
Schwebstoff vom 12.04.2021 bis zum 11.04.2022
| Datum | Konzentration [g/m³] | Abfluss [m³/s] |
|---|---|---|
| 11.04.2022 | 10,8 | 36,1 |
| 10.04.2022 | 22,3 | 42 |
| 09.04.2022 | 104,5 | 57,3 |
| 08.04.2022 | 41,1 | 53,8 |
| 07.04.2022 | 47,3 | 50 |
| 06.04.2022 | 20,1 | 42,6 |
| 05.04.2022 | 7,0 | 29,8 |
© Bayerisches Landesamt für Umwelt 2024