
- Startseite >
- Flüsse >
- Schwebstoff >
- Regnitz >
- Postmünster >
- Jahresgrafik

Jahresgrafik Postmünster / Rott
Schwebstoff vom 20.01.2021 bis zum 19.01.2022
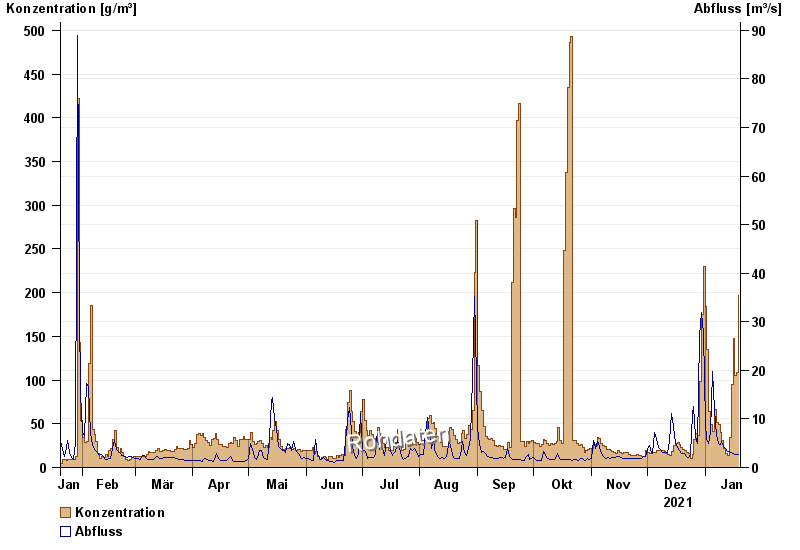
| Datum | Konzentration [g/m³] | Abfluss [m³/s] |
|---|---|---|
| 19.01.2022 | 196,3 | 2,62 |
| 18.01.2022 | 108,6 | 2,65 |
| 17.01.2022 | 105,1 | 2,77 |
| 16.01.2022 | 147,2 | 2,84 |
| 15.01.2022 | 94,8 | 3,05 |
| 14.01.2022 | 34,6 | 3,35 |
| 13.01.2022 | 14,1 | 3,21 |
© Bayerisches Landesamt für Umwelt 2024