
- Startseite >
- Flüsse >
- Schwebstoff >
- Regnitz >
- Landshut Birket >
- Jahresgrafik

Jahresgrafik Landshut Birket / Isar
Schwebstoff vom 10.07.2020 bis zum 09.07.2021
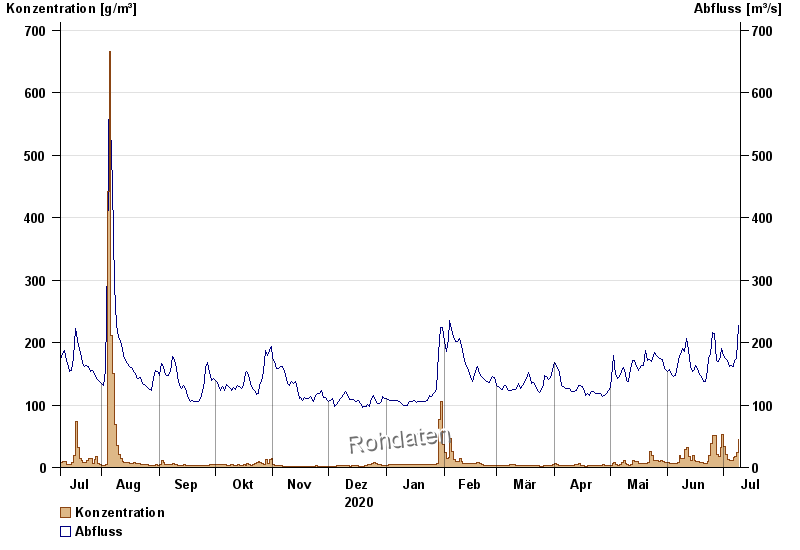
| Datum | Konzentration [g/m³] | Abfluss [m³/s] |
|---|---|---|
| 09.07.2021 | 45,4 | 228 |
| 08.07.2021 | 23,9 | 175 |
| 07.07.2021 | 17,9 | 172 |
| 06.07.2021 | 15,7 | 162 |
| 05.07.2021 | 12,0 | 164 |
| 04.07.2021 | 11,7 | 162 |
| 03.07.2021 | 12,7 | 171 |
© Bayerisches Landesamt für Umwelt 2024