
- Startseite >
- Flüsse >
- Schwebstoff >
- Regnitz >
- Füssen >
- Jahresgrafik

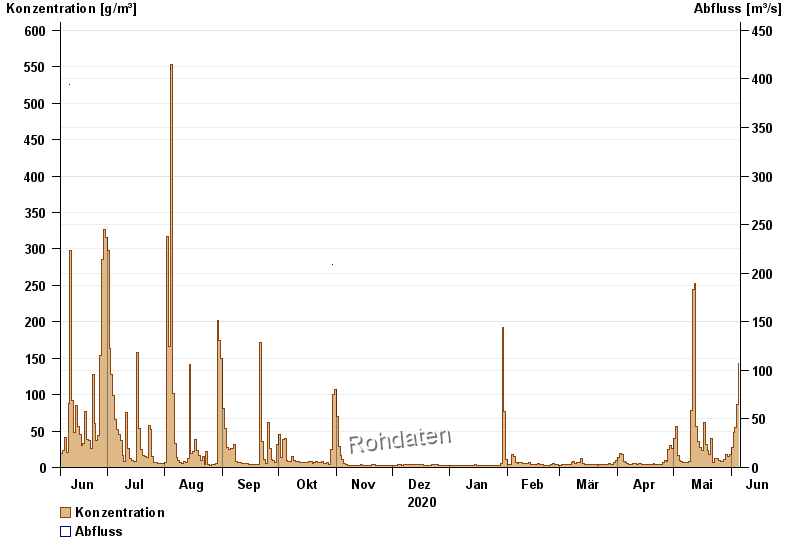
Jahresgrafik Füssen / Lech
Schwebstoff vom 06.06.2020 bis zum 05.06.2021
| Datum | Konzentration [g/m³] | Abfluss [m³/s] |
|---|---|---|
| 05.06.2021 | 142,6 | -- |
| 04.06.2021 | 86,1 | -- |
| 03.06.2021 | 55,4 | -- |
| 02.06.2021 | 47,6 | -- |
| 01.06.2021 | 26,9 | -- |
| 31.05.2021 | 17,9 | -- |
| 30.05.2021 | 14,4 | -- |
© Bayerisches Landesamt für Umwelt 2024