
- Startseite >
- Flüsse >
- Schwebstoff >
- Regnitz >
- Donauwörth >
- Jahresgrafik

Jahresgrafik Donauwörth / Donau
Schwebstoff vom 01.01.2024 bis zum 31.12.2024
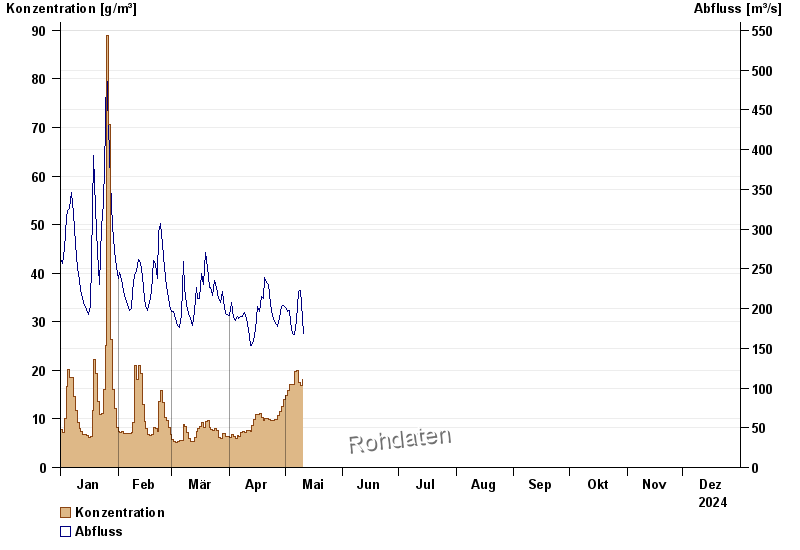
| Datum | Konzentration [g/m³] | Abfluss [m³/s] |
|---|---|---|
| 13.05.2024 | 21,4 | 161 |
| 12.05.2024 | 20,4 | 164 |
| 11.05.2024 | 19,8 | 168 |
| 10.05.2024 | 18,1 | 188 |
| 09.05.2024 | 16,9 | 223 |
| 08.05.2024 | 17,5 | 221 |
| 07.05.2024 | 20,0 | 185 |
© Bayerisches Landesamt für Umwelt 2024