
- Startseite >
- Flüsse >
- Schwebstoff >
- Regnitz >
- Behringersmühle >
- Jahresgrafik

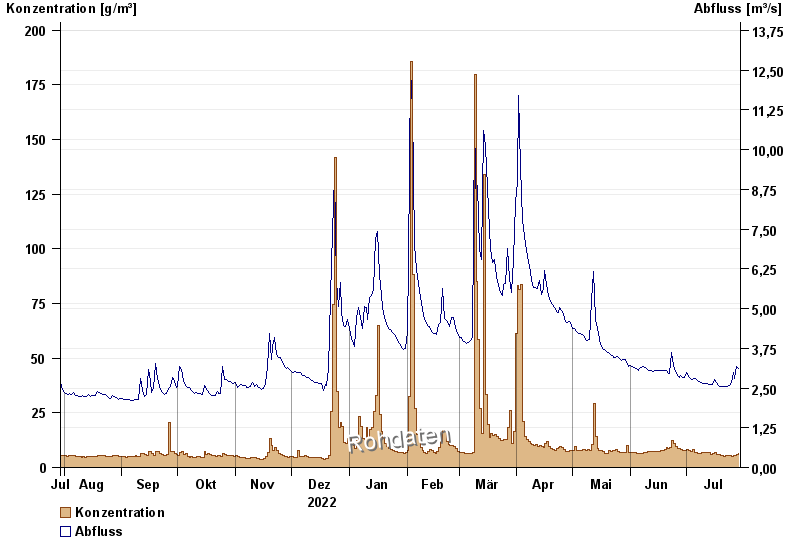
Jahresgrafik Behringersmühle / Wiesent
Schwebstoff vom 30.07.2022 bis zum 29.07.2023
| Datum | Konzentration [g/m³] | Abfluss [m³/s] |
|---|---|---|
| 29.07.2023 | 6,4 | 3,12 |
| 28.07.2023 | 5,9 | 3,17 |
| 27.07.2023 | 5,3 | 2,81 |
| 26.07.2023 | 5,6 | 2,99 |
| 25.07.2023 | 5,2 | 2,68 |
| 24.07.2023 | 5,3 | 2,57 |
| 23.07.2023 | 5,3 | 2,55 |
© Bayerisches Landesamt für Umwelt 2024