
- Startseite >
- Flüsse >
- Schwebstoff >
- Regnitz >
- Bad Tölz Brücke >
- Jahresgrafik

Jahresgrafik Bad Tölz Brücke / Isar
Schwebstoff vom 26.04.2024 bis zum 25.04.2025
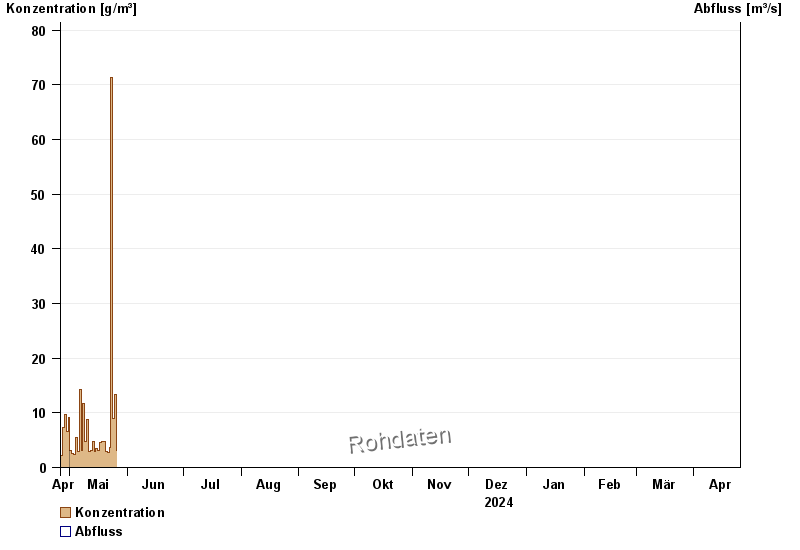
| Datum | Konzentration [g/m³] | Abfluss [m³/s] |
|---|---|---|
| 06.05.2024 | 14,3 | -- |
| 05.05.2024 | 3,0 | -- |
| 04.05.2024 | 5,5 | -- |
| 03.05.2024 | 2,5 | -- |
| 02.05.2024 | 2,5 | -- |
| 01.05.2024 | 3,1 | -- |
| 30.04.2024 | 9,1 | -- |
© Bayerisches Landesamt für Umwelt 2024