
- Startseite >
- Flüsse >
- Schwebstoff >
- Untere Donau >
- Weilheim >
- Jahresgrafik

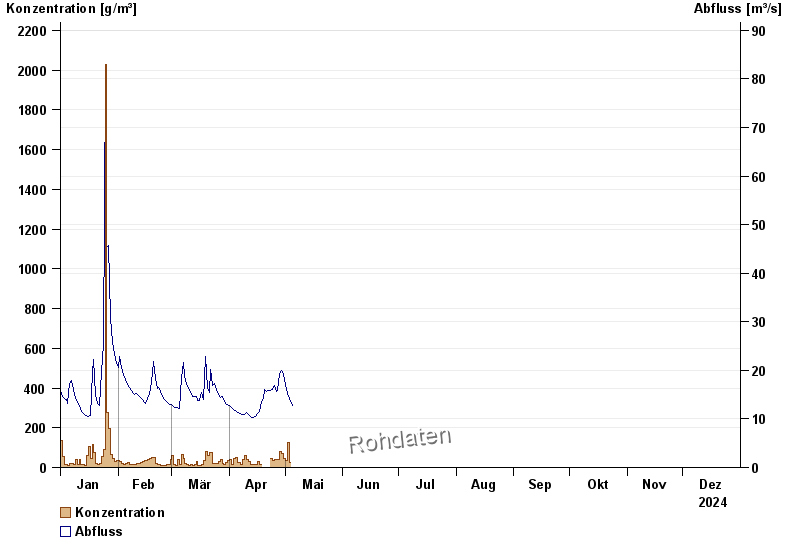
Jahresgrafik Weilheim / Ammer
Schwebstoff vom 01.01.2024 bis zum 31.12.2024
Beeinflussung
Moegliche Beeinflussung durch Bauarbeiten im oder am Gewaesser! Das Bauende ist offen.
| Datum | Konzentration [g/m³] | Abfluss [m³/s] |
|---|---|---|
| 08.05.2024 | 366,4 | 29 |
| 07.05.2024 | 50,6 | 13,3 |
| 06.05.2024 | 63,0 | 13 |
| 05.05.2024 | 55,0 | 12,8 |
| 04.05.2024 | 22,8 | 13,5 |
| 03.05.2024 | 25,1 | 14,2 |
| 02.05.2024 | 124,5 | 15,2 |
© Bayerisches Landesamt für Umwelt 2024