
- Startseite >
- Flüsse >
- Schwebstoff >
- Untere Donau >
- Unterjettenberg >
- Jahresgrafik

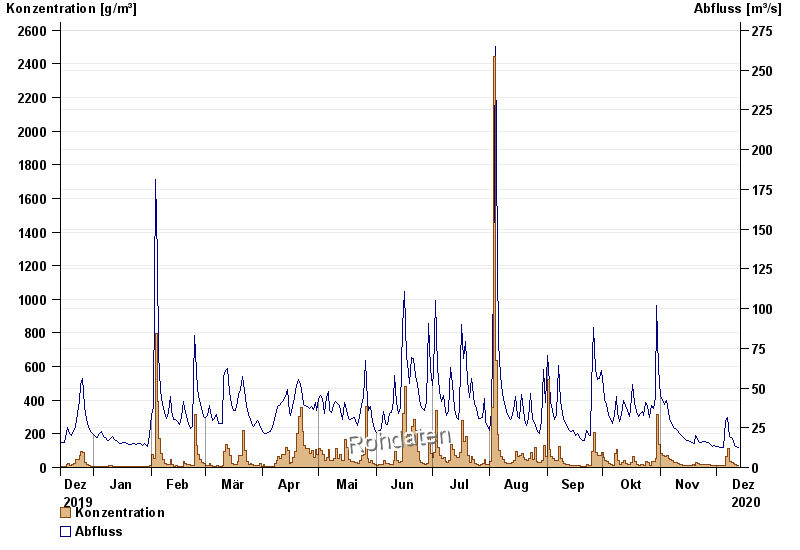
Jahresgrafik Unterjettenberg / Saalach
Schwebstoff vom 14.12.2019 bis zum 13.12.2020
| Datum | Konzentration [g/m³] | Abfluss [m³/s] |
|---|---|---|
| 13.12.2020 | 11,8 | 12,8 |
| 12.12.2020 | 12,1 | 12,9 |
| 11.12.2020 | 15,1 | 13,8 |
| 10.12.2020 | 22,4 | 16,1 |
| 09.12.2020 | 30,9 | 18,8 |
| 08.12.2020 | 33,3 | 19,6 |
| 07.12.2020 | 111,9 | 31,6 |
© Bayerisches Landesamt für Umwelt 2024