
- Startseite >
- Flüsse >
- Schwebstoff >
- Untere Donau >
- Staudach >
- Monatsgrafik

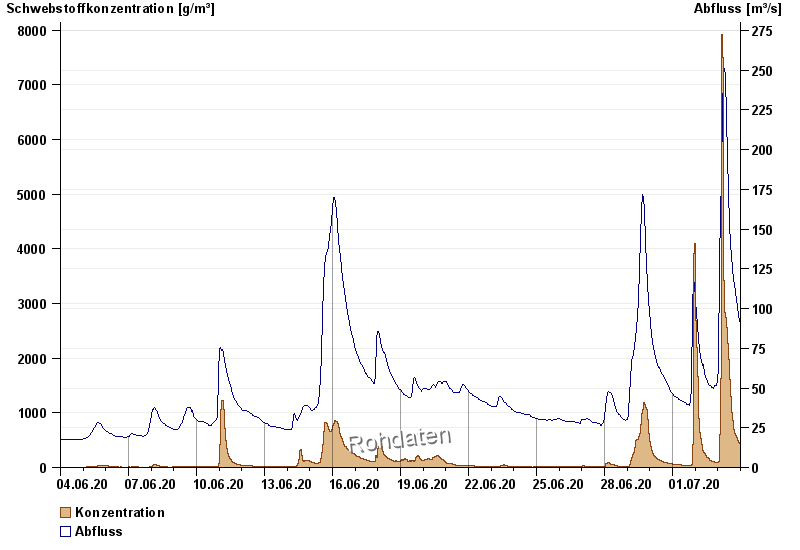
Monatsgrafik Staudach / Tiroler Achen
Schwebstoff vom 04.06.2020 bis zum 03.07.2020
| Datum | Konzentration [g/m³] | Abfluss [m³/s] |
|---|---|---|
| 03.07.2020 23:45 | 395,4 | 83,4 |
| 03.07.2020 23:30 | 399,4 | 85,5 |
| 03.07.2020 23:15 | 403,0 | 86,5 |
| 03.07.2020 23:00 | 410,0 | 87,5 |
| 03.07.2020 22:45 | 409,0 | 88,5 |
| 03.07.2020 22:30 | 416,5 | 89,5 |
| 03.07.2020 22:15 | 422,0 | 89,5 |
© Bayerisches Landesamt für Umwelt 2024