
- Startseite >
- Flüsse >
- Schwebstoff >
- Untere Donau >
- Staudach >
- Monatsgrafik

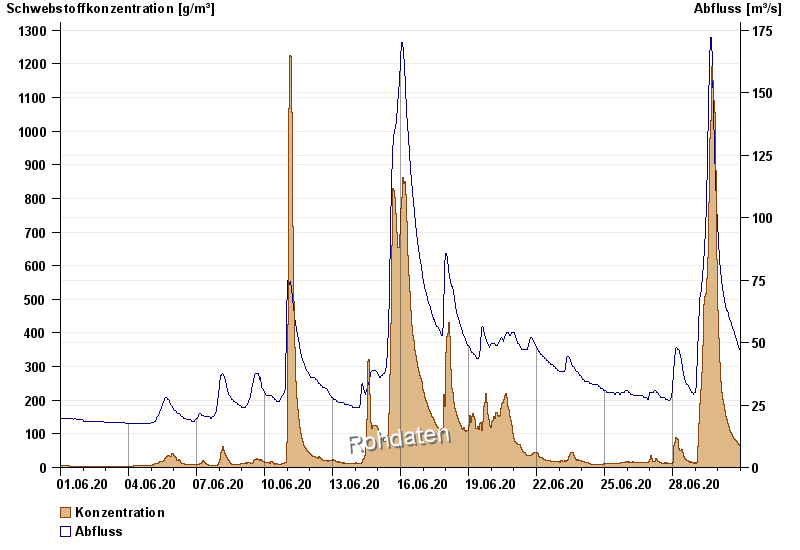
Monatsgrafik Staudach / Tiroler Achen
Schwebstoff vom 01.06.2020 bis zum 30.06.2020
| Datum | Konzentration [g/m³] | Abfluss [m³/s] |
|---|---|---|
| 30.06.2020 23:45 | 58,9 | 45,4 |
| 30.06.2020 23:30 | 60,8 | 45,4 |
| 30.06.2020 23:15 | 61,6 | 46,3 |
| 30.06.2020 23:00 | 61,8 | 46,3 |
| 30.06.2020 22:45 | 63,3 | 46,3 |
| 30.06.2020 22:30 | 62,1 | 46,3 |
| 30.06.2020 22:15 | 63,3 | 47,1 |
© Bayerisches Landesamt für Umwelt 2024