
- Startseite >
- Flüsse >
- Schwebstoff >
- Untere Donau >
- Staudach >
- Jahresgrafik

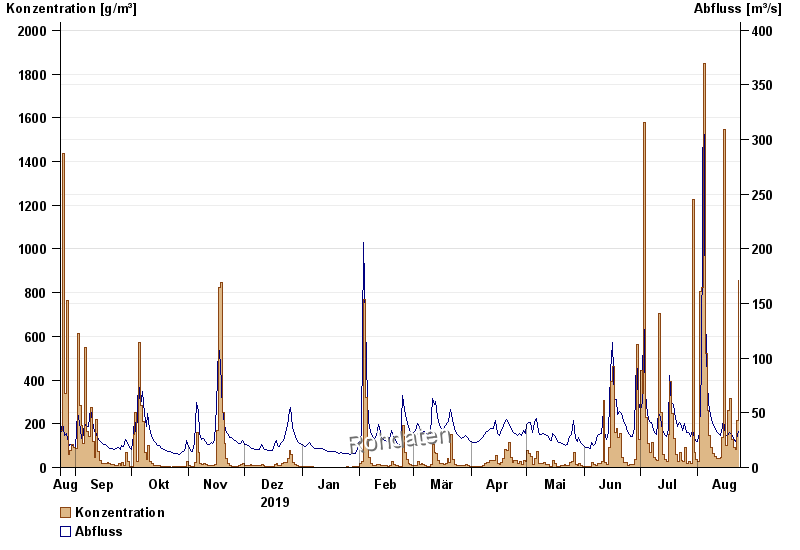
Jahresgrafik Staudach / Tiroler Achen
Schwebstoff vom 24.08.2019 bis zum 23.08.2020
| Datum | Konzentration [g/m³] | Abfluss [m³/s] |
|---|---|---|
| 23.08.2020 | 854,8 | 32,8 |
| 22.08.2020 | 216,7 | 25,8 |
| 21.08.2020 | 83,6 | 23,8 |
| 20.08.2020 | 91,2 | 26,6 |
| 19.08.2020 | 126,4 | 30,4 |
| 18.08.2020 | 314,7 | 32,3 |
| 17.08.2020 | 260,0 | 28,3 |
© Bayerisches Landesamt für Umwelt 2024