
- Startseite >
- Flüsse >
- Schwebstoff >
- Untere Donau >
- Schlehdorf >
- Monatsgrafik

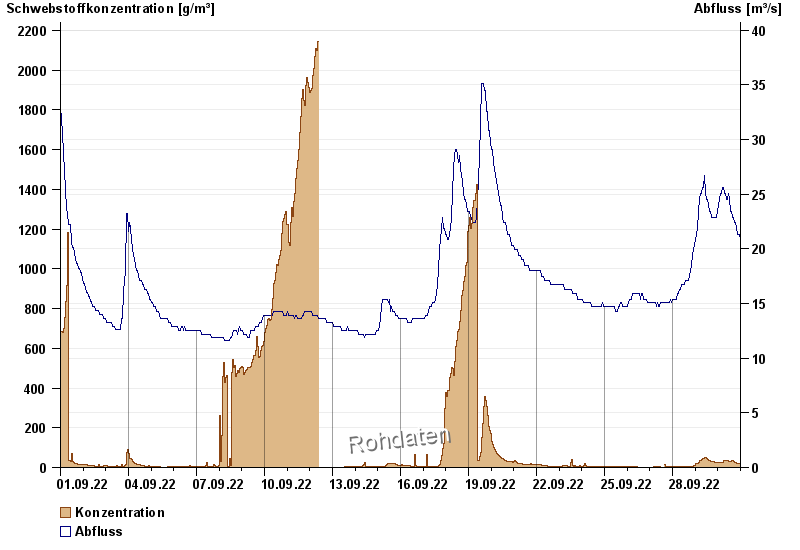
Monatsgrafik Schlehdorf / Loisach
Schwebstoff vom 01.09.2022 bis zum 30.09.2022
| Datum | Konzentration [g/m³] | Abfluss [m³/s] |
|---|---|---|
| 30.09.2022 23:45 | 18,7 | 20,9 |
| 30.09.2022 23:30 | 18,5 | 20,9 |
| 30.09.2022 23:15 | 18,6 | 20,3 |
| 30.09.2022 23:00 | 18,6 | 20,9 |
| 30.09.2022 22:45 | 19,0 | 20,9 |
| 30.09.2022 22:30 | 19,5 | 20,9 |
| 30.09.2022 22:15 | 19,6 | 20,9 |
© Bayerisches Landesamt für Umwelt 2024