
- Startseite >
- Flüsse >
- Schwebstoff >
- Untere Donau >
- Schlehdorf >
- Monatsgrafik

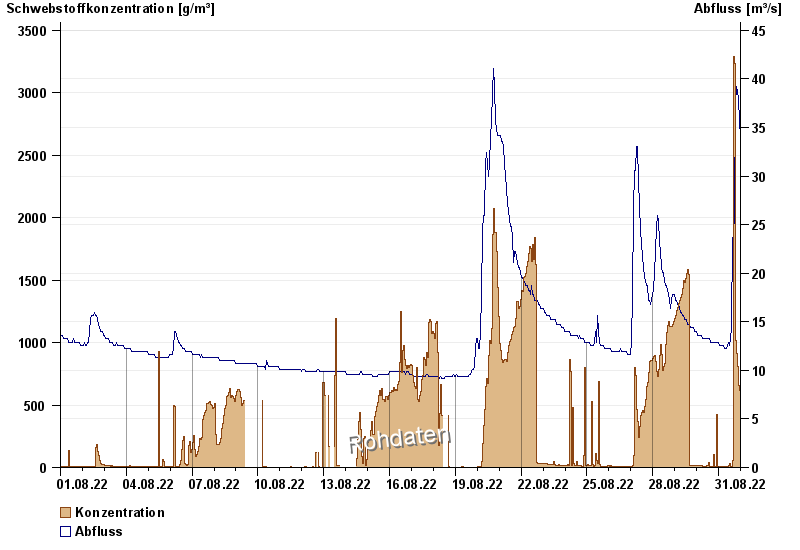
Monatsgrafik Schlehdorf / Loisach
Schwebstoff vom 01.08.2022 bis zum 31.08.2022
| Datum | Konzentration [g/m³] | Abfluss [m³/s] |
|---|---|---|
| 31.08.2022 23:45 | 652,3 | 31,8 |
| 31.08.2022 23:30 | 642,3 | 32,4 |
| 31.08.2022 23:15 | 636,8 | 33 |
| 31.08.2022 23:00 | 637,9 | 33 |
| 31.08.2022 22:45 | 628,7 | 33,6 |
| 31.08.2022 22:30 | 625,6 | 34,2 |
| 31.08.2022 22:15 | 619,8 | 34,2 |
© Bayerisches Landesamt für Umwelt 2024