
- Startseite >
- Flüsse >
- Schwebstoff >
- Untere Donau >
- Schlehdorf >
- Jahresgrafik

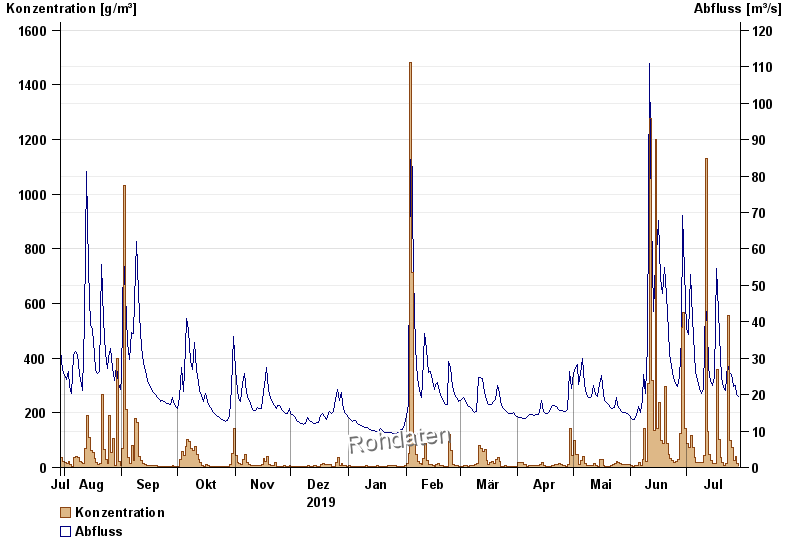
Jahresgrafik Schlehdorf / Loisach
Schwebstoff vom 30.07.2019 bis zum 29.07.2020
| Datum | Konzentration [g/m³] | Abfluss [m³/s] |
|---|---|---|
| 29.07.2020 | 8,3 | 19,6 |
| 28.07.2020 | 14,9 | 20 |
| 27.07.2020 | 42,0 | 22,6 |
| 26.07.2020 | 24,3 | 22,1 |
| 25.07.2020 | 74,3 | 25,4 |
| 24.07.2020 | 100,6 | 26 |
| 23.07.2020 | 557,6 | 28,2 |
© Bayerisches Landesamt für Umwelt 2024