
- Startseite >
- Flüsse >
- Schwebstoff >
- Untere Donau >
- Schlehdorf >
- Jahresgrafik

Jahresgrafik Schlehdorf / Loisach
Schwebstoff vom 01.01.2023 bis zum 31.12.2023
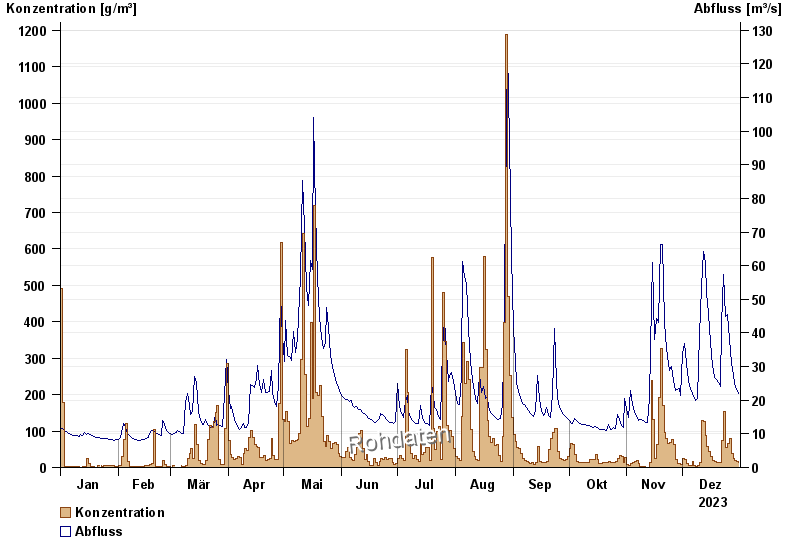
| Datum | Konzentration [g/m³] | Abfluss [m³/s] |
|---|---|---|
| 31.12.2023 | 10,0 | 21,9 |
| 30.12.2023 | 10,4 | 23,1 |
| 29.12.2023 | 11,6 | 25,1 |
| 28.12.2023 | 12,4 | 27,4 |
| 27.12.2023 | 18,4 | 30,9 |
| 26.12.2023 | 60,9 | 38,2 |
| 25.12.2023 | 54,9 | 45,4 |
© Bayerisches Landesamt für Umwelt 2025