
- Startseite >
- Flüsse >
- Schwebstoff >
- Untere Donau >
- Postmünster >
- Jahresgrafik

Jahresgrafik Postmünster / Rott
Schwebstoff vom 23.07.2022 bis zum 22.07.2023
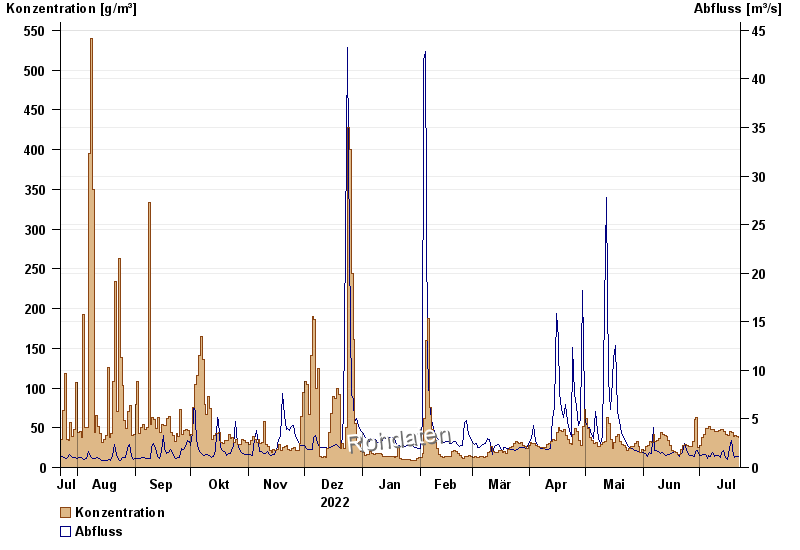
| Datum | Konzentration [g/m³] | Abfluss [m³/s] |
|---|---|---|
| 22.07.2023 | 38,1 | 1,11 |
| 21.07.2023 | 39,6 | 1,12 |
| 20.07.2023 | 38,1 | 1,02 |
| 19.07.2023 | 34,7 | 1,24 |
| 18.07.2023 | 47,7 | 2,81 |
| 17.07.2023 | 52,3 | 1,99 |
| 16.07.2023 | 31,3 | 0,785 |
© Bayerisches Landesamt für Umwelt 2024