
- Startseite >
- Flüsse >
- Schwebstoff >
- Untere Donau >
- Postmünster >
- Jahresgrafik

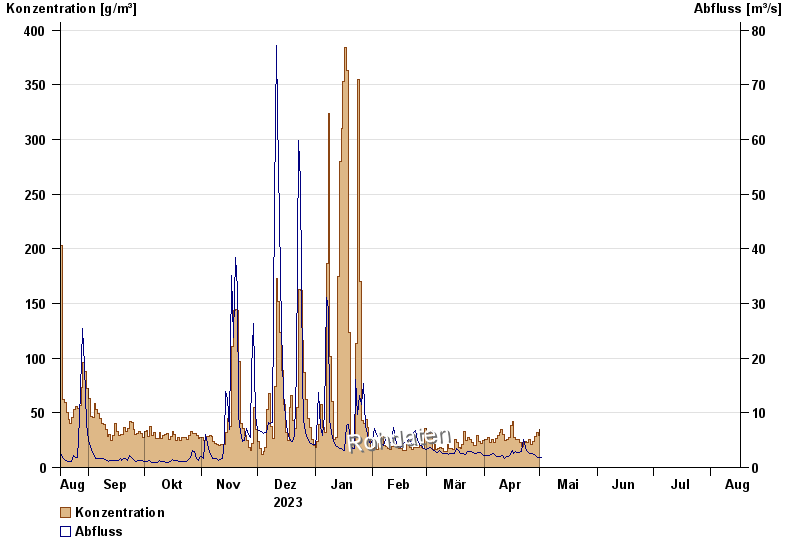
Jahresgrafik Postmünster / Rott
Schwebstoff vom 17.08.2023 bis zum 16.08.2024
| Datum | Konzentration [g/m³] | Abfluss [m³/s] |
|---|---|---|
| 18.04.2024 | 25,7 | 2,86 |
| 17.04.2024 | 27,8 | 2,54 |
| 16.04.2024 | 42,4 | 3,19 |
| 15.04.2024 | 38,6 | 2,41 |
| 14.04.2024 | 27,4 | 1,98 |
| 13.04.2024 | 25,4 | 2,02 |
| 12.04.2024 | 24,5 | 1,67 |
© Bayerisches Landesamt für Umwelt 2024