
- Startseite >
- Flüsse >
- Schwebstoff >
- Untere Donau >
- Postmünster >
- Jahresgrafik

Jahresgrafik Postmünster / Rott
Schwebstoff vom 17.08.2021 bis zum 16.08.2022
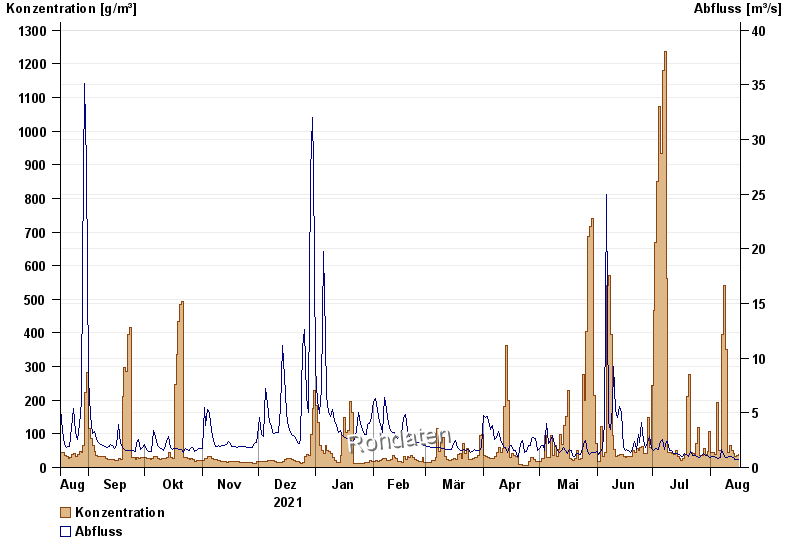
| Datum | Konzentration [g/m³] | Abfluss [m³/s] |
|---|---|---|
| 16.08.2022 | 39,7 | 0,765 |
| 15.08.2022 | 35,0 | 0,762 |
| 14.08.2022 | 32,0 | 0,743 |
| 13.08.2022 | 43,0 | 0,884 |
| 12.08.2022 | 51,5 | 0,989 |
| 11.08.2022 | 65,5 | 0,969 |
| 10.08.2022 | 44,1 | 0,953 |
© Bayerisches Landesamt für Umwelt 2024