
- Startseite >
- Flüsse >
- Schwebstoff >
- Untere Donau >
- Plattling >
- Monatsgrafik

Monatsgrafik Plattling / Isar
Schwebstoff vom 30.03.2024 bis zum 29.04.2024
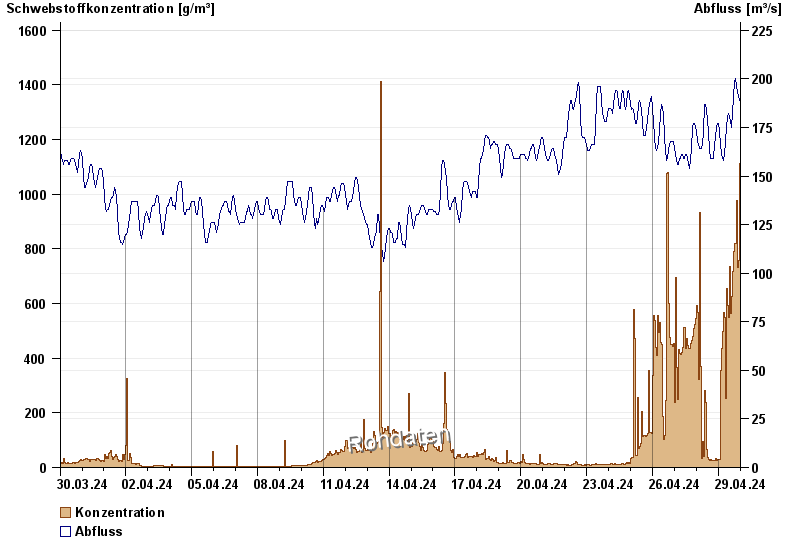
| Datum | Konzentration [g/m³] | Abfluss [m³/s] |
|---|---|---|
| 29.04.2024 23:45 | 40,4 | 189 |
| 29.04.2024 23:30 | 41,0 | 189 |
| 29.04.2024 23:15 | 265,8 | 189 |
| 29.04.2024 23:00 | 596,4 | 189 |
| 29.04.2024 22:45 | 841,2 | 189 |
| 29.04.2024 22:30 | 1068,9 | 189 |
| 29.04.2024 22:15 | 962,1 | 189 |
© Bayerisches Landesamt für Umwelt 2024