
- Startseite >
- Flüsse >
- Schwebstoff >
- Untere Donau >
- Plattling >
- Monatsgrafik

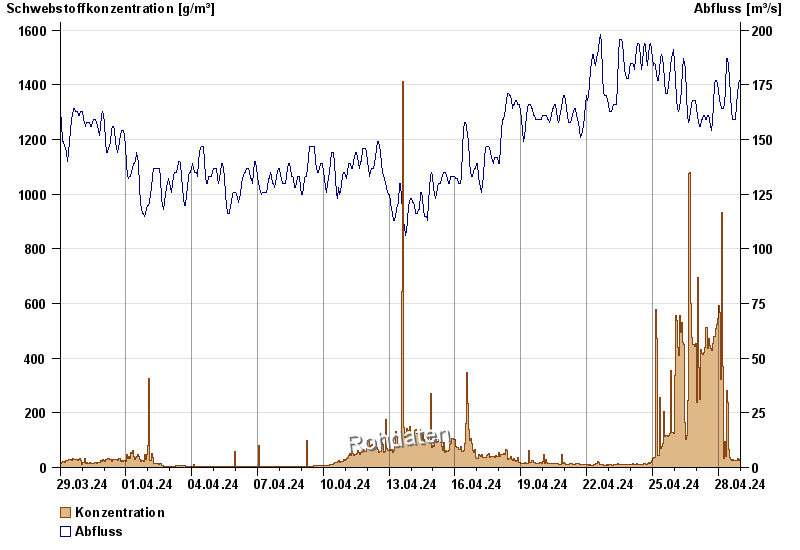
Monatsgrafik Plattling / Isar
Schwebstoff vom 29.03.2024 bis zum 28.04.2024
| Datum | Konzentration [g/m³] | Abfluss [m³/s] |
|---|---|---|
| 26.04.2024 23:45 | 204,7 | 159 |
| 26.04.2024 23:30 | 173,1 | 161 |
| 26.04.2024 23:15 | 236,3 | 161 |
| 26.04.2024 23:00 | 236,7 | 163 |
| 26.04.2024 22:45 | 185,4 | 164 |
| 26.04.2024 22:30 | 103,9 | 164 |
| 26.04.2024 22:15 | 156,2 | 166 |
© Bayerisches Landesamt für Umwelt 2024