
- Startseite >
- Flüsse >
- Schwebstoff >
- Untere Donau >
- Passau Marienbrücke >
- Jahresgrafik

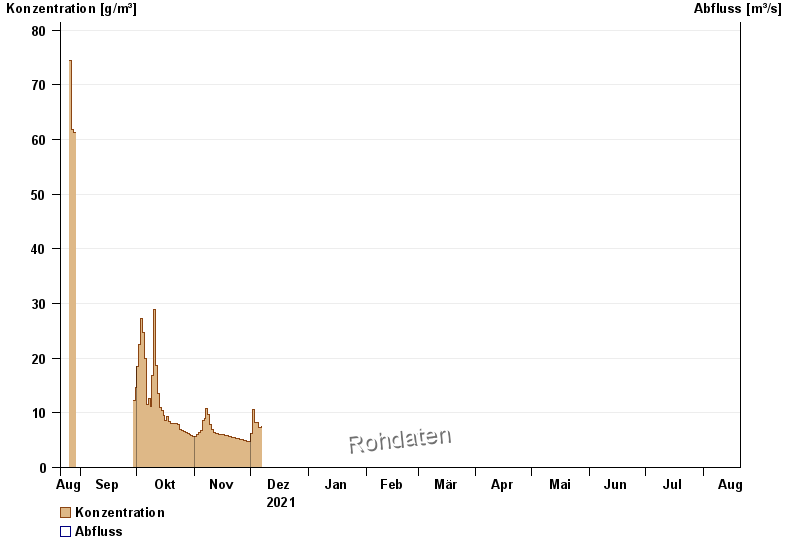
Jahresgrafik Passau Marienbrücke / Inn
Schwebstoff vom 21.08.2021 bis zum 20.08.2022
| Datum | Konzentration [g/m³] | Abfluss [m³/s] |
|---|---|---|
| 07.12.2021 | 7,4 | -- |
| 06.12.2021 | 7,4 | -- |
| 05.12.2021 | 7,3 | -- |
| 04.12.2021 | 8,2 | -- |
| 03.12.2021 | 8,3 | -- |
| 02.12.2021 | 10,7 | -- |
| 01.12.2021 | 6,1 | -- |
© Bayerisches Landesamt für Umwelt 2024