
- Startseite >
- Flüsse >
- Schwebstoff >
- Untere Donau >
- Linden >
- Jahresgrafik

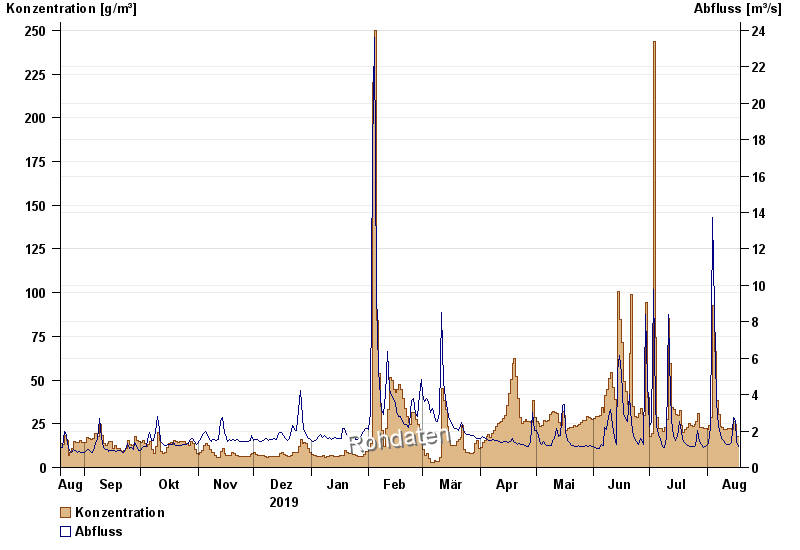
Jahresgrafik Linden / Rott
Schwebstoff vom 19.08.2019 bis zum 18.08.2020
| Datum | Konzentration [g/m³] | Abfluss [m³/s] |
|---|---|---|
| 18.08.2020 | 17,6 | 1,16 |
| 17.08.2020 | 17,8 | 1,42 |
| 16.08.2020 | 24,5 | 2,59 |
| 15.08.2020 | 26,5 | 2,75 |
| 14.08.2020 | 21,5 | 1,35 |
| 13.08.2020 | 22,1 | 1,28 |
| 12.08.2020 | 22,4 | 1,29 |
© Bayerisches Landesamt für Umwelt 2024