
- Startseite >
- Flüsse >
- Schwebstoff >
- Untere Donau >
- Linden >
- Jahresgrafik

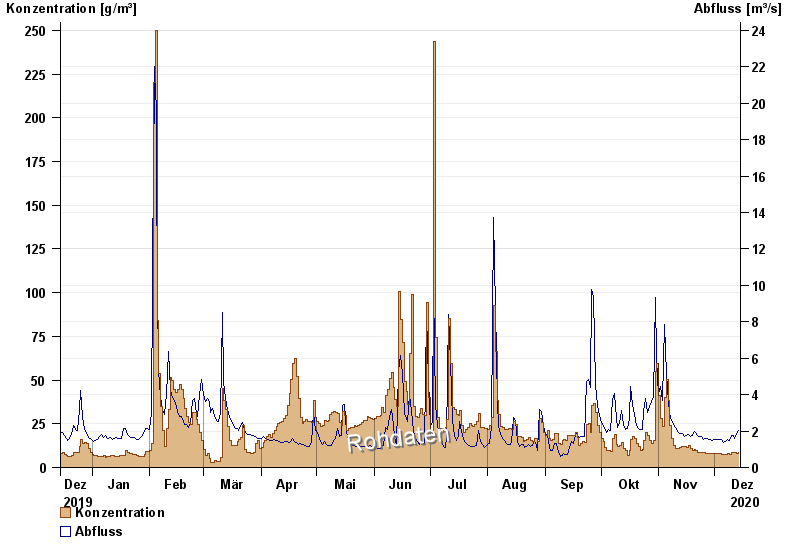
Jahresgrafik Linden / Rott
Schwebstoff vom 15.12.2019 bis zum 14.12.2020
| Datum | Konzentration [g/m³] | Abfluss [m³/s] |
|---|---|---|
| 14.12.2020 | 8,7 | 2,01 |
| 13.12.2020 | 8,1 | 1,87 |
| 12.12.2020 | 8,3 | 1,58 |
| 11.12.2020 | 8,8 | 1,74 |
| 10.12.2020 | 8,6 | 1,78 |
| 09.12.2020 | 7,6 | 1,49 |
| 08.12.2020 | 7,8 | 1,56 |
© Bayerisches Landesamt für Umwelt 2024