
- Startseite >
- Flüsse >
- Schwebstoff >
- Untere Donau >
- Linden >
- Jahresgrafik

Jahresgrafik Linden / Rott
Schwebstoff vom 06.08.2020 bis zum 05.08.2021
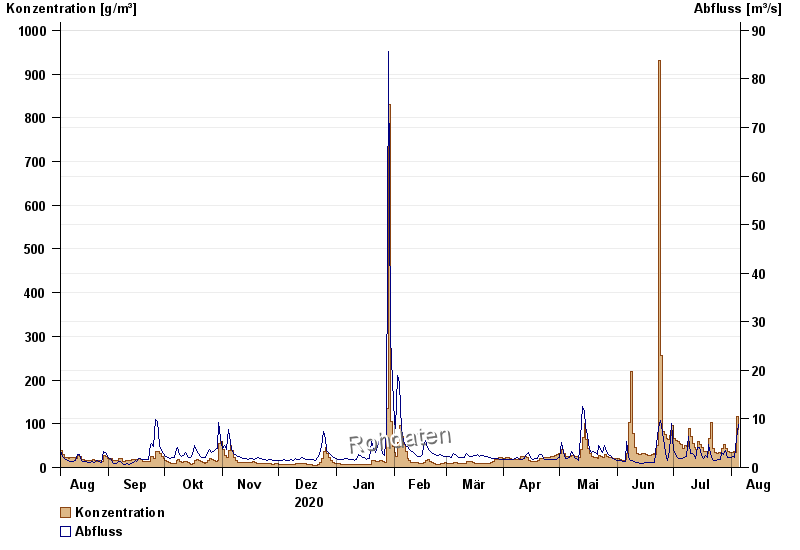
| Datum | Konzentration [g/m³] | Abfluss [m³/s] |
|---|---|---|
| 05.08.2021 | 86,6 | 8,92 |
| 04.08.2021 | 116,4 | 5,89 |
| 03.08.2021 | 34,2 | 1,96 |
| 02.08.2021 | 35,6 | 2,28 |
| 01.08.2021 | 35,1 | 2,15 |
| 31.07.2021 | 33,5 | 2,13 |
| 30.07.2021 | 35,9 | 1,99 |
© Bayerisches Landesamt für Umwelt 2024